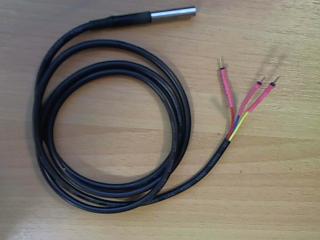
The DS18B20 temperature sensor can be connected in parallel and is also available in cable format.
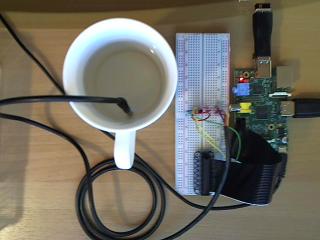
A simple experiment is to investigate the cooling of a hot cup of water over an extended time.
For this cable, connections have been soldered on and shrink wrapped for a more robust connection with the breadboard..
 http://www.adafruit.com/products/381#Technical_Details
Follow setup details for a single sensor and then put the extra sensor in parallel.
Two files are created,each with different seriall numbers, when the temperature sensors are working.
If your sensor has three wires - Red connects to 3 - 5 V, Blue/Black connects to ground and Yellow/White is data
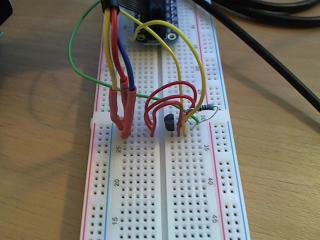
Setup of temperature probes is similar to a previous post (Trying to connect temperature sensor DS18B20) but allows for multiple sensors.
ReadList is more efficent than Import when getting the temperature from the file.
devicefolder[i_] := FileNames["28-*", {"/sys/bus/w1/devices"}][[i]];
Run["sudo modprobe w1-gpio"];
Run["sudo modprobe w1-therm"];
devicefile[i_] := FileNameJoin[{devicefolder[i], "w1_slave"}];
temperature[devicefile_String] := Flatten[StringCases[ReadList[devicefile, String],
"t=" ~~ x___ :> ToExpression[x]/1000., 1]][[1]];
I decided it would be nice to save the data to dropbox in a text file by following this tutorial, however you could easily store the data within Mathematica.
http://raspi.tv/2013/how-to-use-dropbox-with-raspberry-piupload[filesourcepath_, savedir_String] :=
Run["/home/pi/Dropbox-Uploader/dropbox_uploader.sh upload " <>
filesourcepath <> " " <>
FileNameJoin[{savedir, FileNameTake[filesourcepath]}]];
Record the data after creating an empty text file. After a time put some boiled water in the cup. Record data every five seconds and upload every two minutes.
file = "/home/pi/Desktop/temperaturedata.txt";
task1 = CreateScheduledTask[upload[file, "temperaturexperiment"], 120];
task2 = CreateScheduledTask[PutAppend[{DateList[AbsoluteTime[]],
temperature[devicefile[1]], temperature[devicefile[2]]}, file], 5];
StartScheduledTask[{task1, task2}]
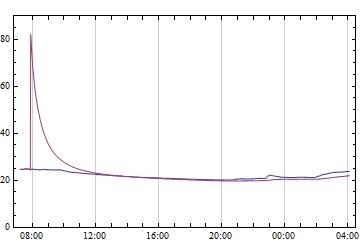
Results
The data is imported and the outliers are removed quickly.
data = Import["C:\\Users\\2moro\\Downloads\\temperaturedata (18).txt","Lines"];
data1 = DeleteCases[data[[All, {1, 2}]], {x__, y_} /; y < 10 || y >= 30];
data2 = DeleteCases[data[[All, {1, 3}]], {x__, y_} /; y < 10];
DateListPlot[{data1, data2}, Joined -> True, PlotRange -> {0, 90}]
As an initial step, students could investigate Newton's law of Cooling.
More advanced students could model temperature changes when a known stimulus is applied to the system.
Note the smoother response of the temperature sensor in the water to changes in room temperature.


