Message Boards Message Boards

0
|
39321 Views
|
7 Replies
|
5 Total Likes
View groups...
Share
Share this post:

How to import data from an Excel spreadsheet

Posted 11 years ago
Hello All, 
I visualized a map of Kazakhstan. 
I have the data in an Excel file.
Could you please help me to Import the data from Excel and visualize that data into a graph(map) by region?
Which functions do I need to use?
Thank you in advance.
Attachments:
POSTED BY: Guldana Taganova
7 Replies

MyData = Import["myfile.xlsx", "Data", HeaderLine->1]

Or if there's is no header line MyData = Import["myfile.xlsx", "DataSet"] Use menu Import/Path... if the file is in out of Mathematica 11.3 paths. Sorry it there's are errors, I wrote it from memory. Data and DataSet produce different structures. Look in Help for XLSX. Marcin

POSTED BY: Marcin Balcerzyk
How would you import excell data files into Mathematica and inverse?

luke,       lashofer1@gmail.com
A quick bit of advice. Do not define symbols in Mathematica using the underscore character.  Something like
DataColumn2_All

is a pattern rather than a variable/symbol.  Assigning a value to it will yield an error message.
POSTED BY: David Reiss
hello Diego, thank you so much for your reply. it is so useful and interesting. i wanted to use my polygons which is in my previous attached file. is it possible to use it? and could you please explain how you used your codes?
POSTED BY: Guldana Taganova
Posted 11 years ago
Please add this to your file.
  data = Rest[Import["country map.xlsx"][[1]]]
 minValue = 8
 maxValue = 22
 dataRule = MapThread[Rule, {data[[All, 1]], data[[All, 5]]}]
 myColorScale[value_, min_, max_] :=
  If[MatchQ[Head@value, String], RGBColor[.3, .3, .3],
   N[ColorData["TemperatureMap"][(value - min)/(max - min)]]]
 Graphics[statedata /.
   Rule[a_, b_] :>
   Tooltip[{FaceForm[myColorScale[a /. dataRule, minValue, maxValue]],
      EdgeForm[{Black, Thick}],
     b /. ({x_, y_} /; Not[70 < x < 1000] :> Sequence[]) /. {x_,
        y_} :> {x, -y}}, a], ImageSize -> 1000]
POSTED BY: Diego Zviovich
Posted 11 years ago
You can download the shapefiles from the Global Administrative Areas.
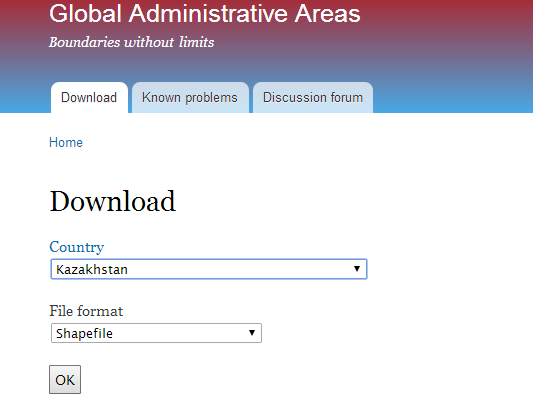
If you expand the Zip File you'll find that the regions can be found at level 1. So we can import both th shapefile and database into Mathematica.
 kazakhstan = Import["C:\\Users\\Diego\\Documents\\Downloads\\KAZ_adm\\KAZ_adm1.shp", "Graphics"];
 
 regions = Import["C:\\Users\\Diego\\Documents\\Downloads\\KAZ_adm\\KAZ_adm1.dbf"];


 (*Modified the XLS file so the names of the Regions will match in XLS *)
 
 data = Import["ModifiedCountryMap.xlsx", "Data"][[1]] // Rest;

(*Shapes of the different regions can be found at this level of the list - This was done by checking the list content visually *)

regionsKaz = kazakhstan[[1]][[2]][[1]][[2]];

minValue = Min@data[[All, 5]]; maxValue = Max@data[[All, 5]];

myScale[value_, min_, max_] := (value - min)/(max - min) // N


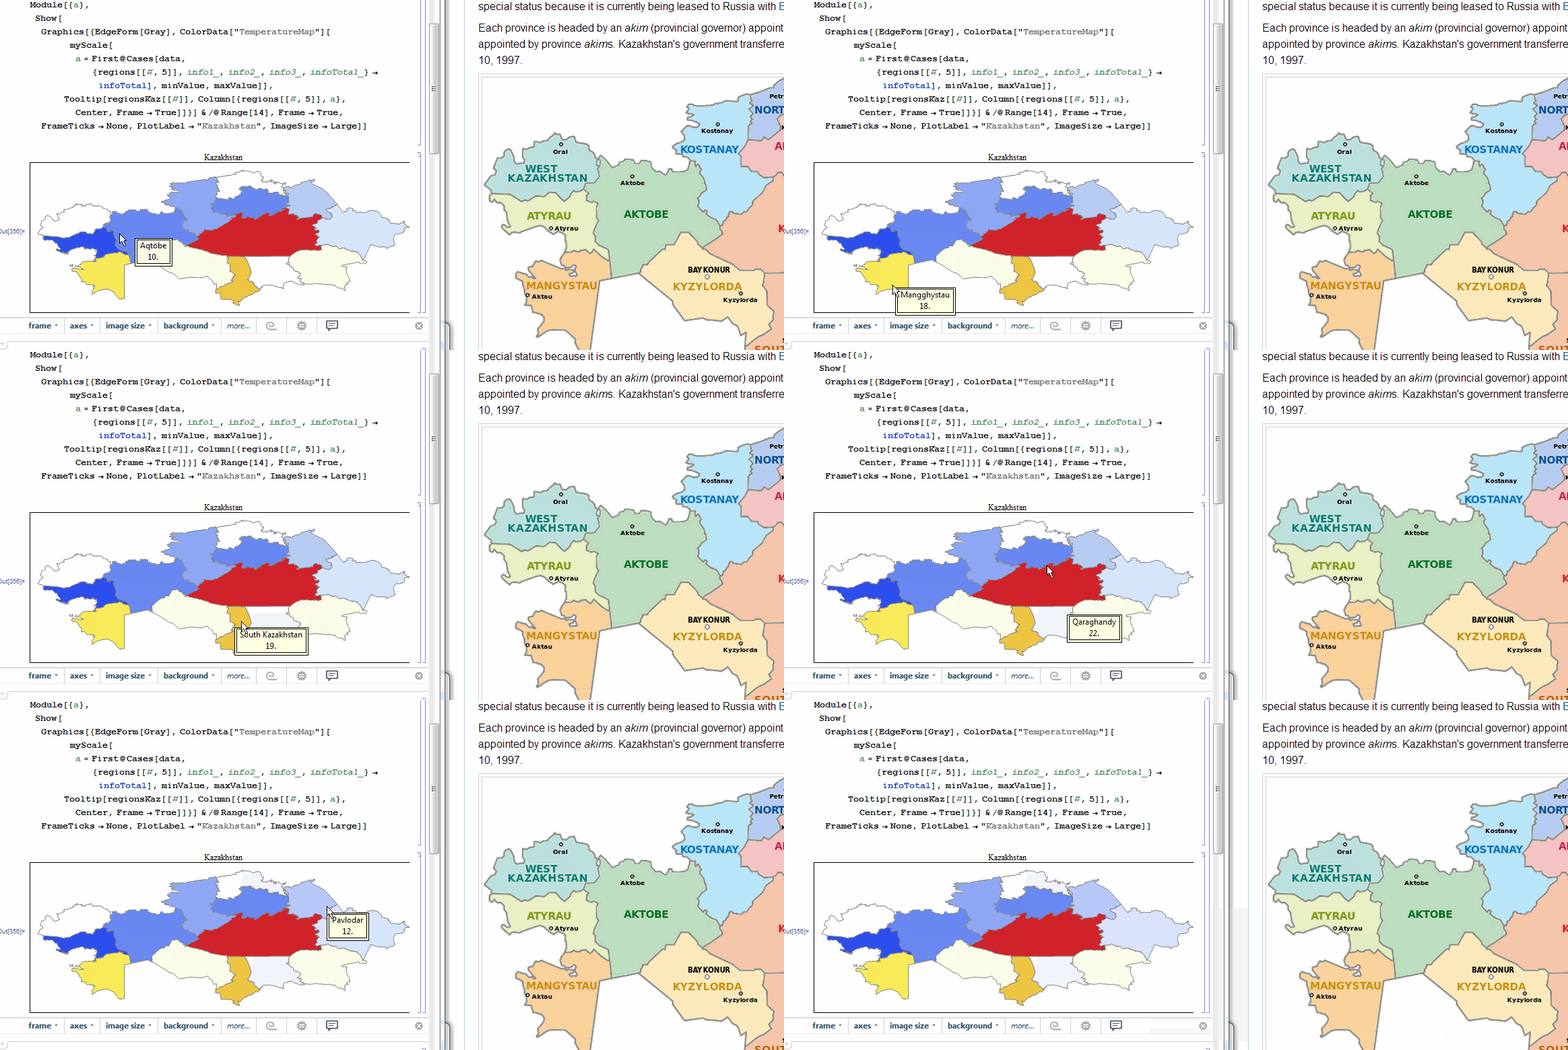
(*Testing to see if the map works*)

Module[{a},Show[Graphics[{EdgeForm[Gray],  ColorData["TemperatureMap"][ myScale[a = First@Cases[data, {regions[[#, 5]], info1_, info2_, info3_, infoTotal_} -> infoTotal], minValue, maxValue]], Tooltip[regionsKaz[[#]],Column[{regions[[#, 5]], a}, Center, Frame -> True]]}] & /@ Range[14], Frame -> True, FrameTicks -> None, PlotLabel -> "Kazakhstan", ImageSize -> Large]]
Attachments:
POSTED BY: Diego Zviovich
Hi Guldana,

1. Example to import data from column 2 -> All
DataColumn2_All =
  Import["Wolfram Mathematica/......../country_map.xlsx", {"Data"}][[1, All],2]]

2. Example to import data from column 2 from row 2 to 10:
DataColumn2_Range =
  Import["Wolfram Mathematica/......../country_map.xlsx", {"Data"}][[1, Range[2, 2923],2]]

I hope this will help!
Jos
POSTED BY: Jos Klaps
Reply to this discussion
Community posts can be styled and formatted using the Markdown syntax.
Reply Preview
Attachments
Remove
or Discard

Group Abstract Group Abstract