Quasicrystals ( Nobel Prize in Chemistry in 2011 ) are structures that are build from finite set of primitive units, perfectly ordered but aperiodic. Let's consider one dimensional (1D) case of the following substitution system:
S -> L
L -> LS
Or, a shorter stick transforms to longer one, and a longer stick is replaced by a pair of long and short ones. Mathematica code is easy to write, here are two basic versions with symbols and strings giving same result:
Grid[NestList[Flatten[# /. {S -> L, L -> {L, S}}] &, {S}, 9], Spacings -> {0, 0}]

Column[NestList[StringReplace[#, {"o" -> "-", "-" -> "-o"}] &, "-", 8], Spacings -> 0]

We can continue this substitution process infinitely and in this limit ratio of fraction of longer to shorter pieces goes to Golden Ratio. Not surprising, - number of L's and S's in sequential generations is given by
Fibonacci numbers. And the problem is identical to
Fibonacci Rabbits setup.
Interesting part is that sequence of L's and S's is perfectly ordered (predictable) but is aperiodic. Meaning one cannot find a finite sub-sequence to shift it repeatedly in order to recover the whole L-S-... chain. In other words - there is
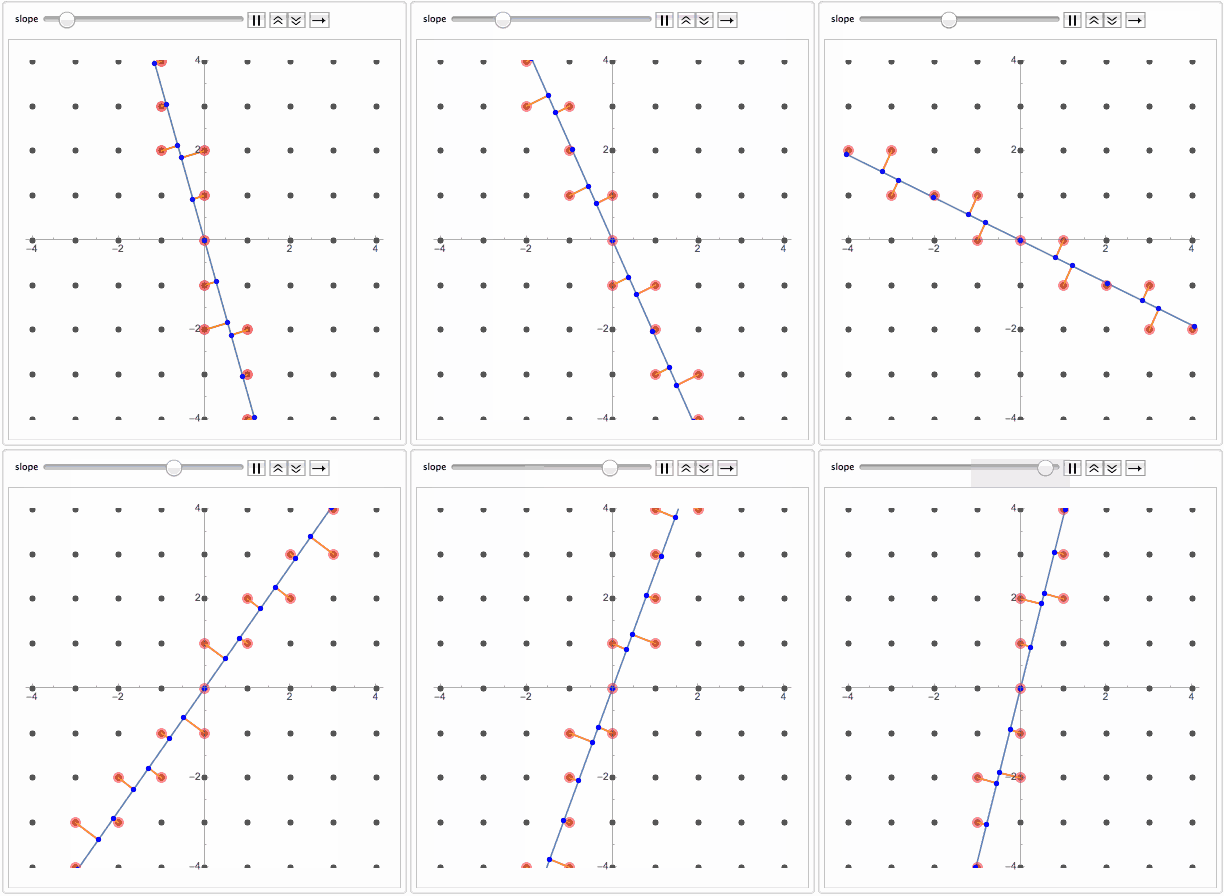
no translational symmetry. This is called Quasicrystal. Now even more surprising fact is that the same sequence can be obtained by projecting regular lattice dimension D on a manifold dimension D-k. For example projecting 2D grid on a line. If a line is at an irrational slope that avoids any lattice plane, then nearest lattice points projected on the line will slice it into quasicrystal sequence.

Animate[
Module[{grid, f, lndat, near, lnpts, lines, bnd1, bnd2},
grid = Flatten[Outer[List, Range[-6, 6], Range[-6, 6]], 1];
f[x_] := m x;
lndat =
Select[{#, f[#]} & /@ Range[-6, 6, .01], -6 < #[[2]] < 6 &];
near = Union[Flatten[Nearest[grid, #] & /@ lndat, 1]];
lnpts = First[Nearest[lndat, #]] & /@ near;
lines = Line /@ Thread[{near, lnpts}];
Show[Plot[f[x], {x, -4, 4}, PlotRange -> 4],
Graphics[{{Opacity[.7], PointSize[.017], Point[grid]}, {Red,
Opacity[.5], PointSize[.03], Point[near]}, {Orange,
Thickness[.005], lines}, {PointSize[.015], Blue,
Point[lnpts]}}], AspectRatio -> 1]],
{{m, -4, "slope"}, -4, 4}, AnimationRunning -> False,
AnimationRate -> .5]
Or adding band of nearest points ( see code at the end ):

What happens when we go from 1D to 2D quasicrystals? Well thing get a bit more complicated. A bit history from
Wikipedia:
In 1961, Hao Wang asked whether determining if a set of tiles admits a tiling of the plane is an algorithmically unsolvable problem or not. He conjectured that it is solvable, relying on the hypothesis that any set of tiles, which can tile the plane can do it periodically (hence, it would suffice to try to tile bigger and bigger patterns until obtaining one that tiles periodically). Nevertheless, two years later, his student, Robert Berger, constructed a set of some 20,000 square tiles (now called Wang tiles), which can tile the plane but not in a periodic fashion. As the number of known aperiodic sets of tiles grew, each set seemed to contain even fewer tiles than the previous one. In particular, in 1976,
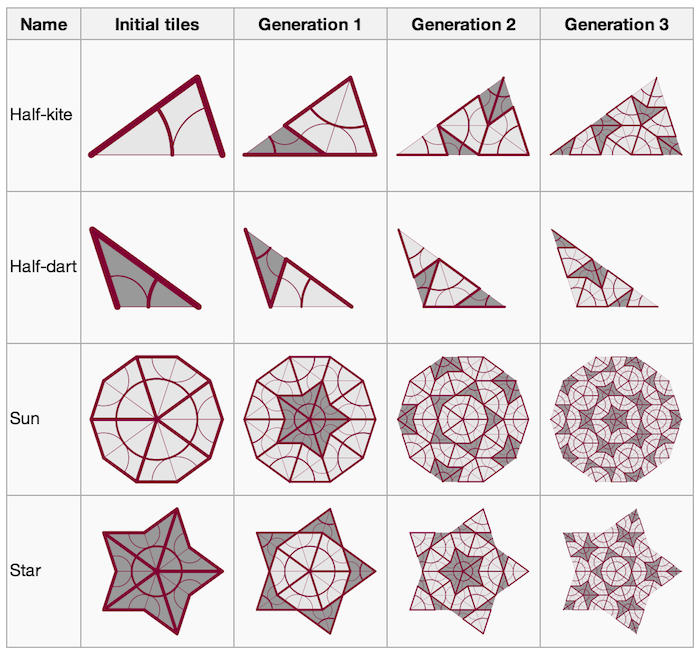
Roger Penrose proposed a set of just two tiles, up to rotation, (referred to as Penrose tiles) that produced only non-periodic tilings of the plane. These tilings displayed instances of fivefold symmetry.
Can Penrose Tiling be obtained by projection? Yes! In 1981, De Bruijn explained a method in which Penrose tilings are obtained as
2D projections from a 5D cubic structure. Explore
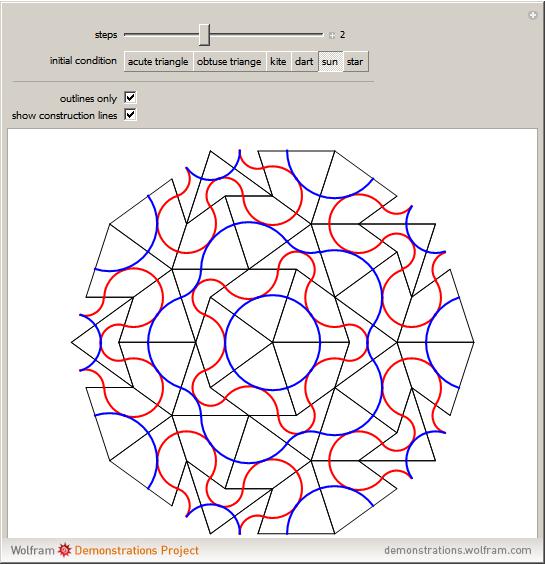
tilings at the Wolfram Demonstrations, in particular, take a look at beautiful "
Penrose Tiles" from Stephen Wolfram, Lyman Hurd, and Joe Bolte:

 Appendix: code for 1D quasicrystal with bands
 Animate[
Module[
{grid, f, lndat, near, lnpts, lines, bnd1, bnd2},
grid = Flatten[Outer[List, Range[-6, 6], Range[-6, 6]], 1];
f[x_] := m x;
lndat =
Select[{#, f[#]} & /@ Range[-6, 6, .01], -6 < #[[2]] < 6 &];
near = Union[Flatten[Nearest[grid, #] & /@ lndat, 1]];
lnpts = First[Nearest[lndat, #]] & /@ near;
lines = Line /@ Thread[{near, lnpts}];
{bnd1[x], bnd2[x]} =
m x + (#2 -
m #1) & @@@ (Sort[#,
EuclideanDistance @@ #1 > EuclideanDistance @@ #2 &] & /@
GatherBy[
Thread[{near, lnpts}], #[[1, 1]] - #[[2, 1]] > 0 &])[[All, 1,
1]];
Show[
Plot[Evaluate@{f[x], bnd1[x], bnd2[x]}, {x, -4, 4}, PlotRange -> 4,
PlotStyle -> {Automatic, Dashed, Dashed},
Filling -> {2 -> {3}}],
Graphics[{
{Opacity[.5], PointSize[.015], Point[grid]},
{Red, Opacity[.5], PointSize[.03], Point[near]},
{Orange, Thickness[.005], lines},
{PointSize[.015], Blue, Point[lnpts]}}]
, AspectRatio -> 1]
]
, {{m, -4, "slope"}, -4, 4}, AnimationRunning -> False,
AnimationRate -> .5]