Sure. FindMinimum using the starting ellipse coefficients as a search starting point with no other constraints :
{res, coes} = FindMinimum[distance, {{aa, a}, {bb, b}, {cc, c}, {dd, d}, {ff, f}, {gg, g}}];
FindMinimum using the starting ellipse coefficients and the initial constraints :
{res, coes} = FindMinimum[{distance,
  -bb^2 + aa*cc > 0.,
  (-cc*dd^2 + 2 bb*dd*ff - aa*ff^2 - bb^2*gg + aa*cc *gg)/(aa + cc) < 0.},
{{aa, a}, {bb, b}, {cc, c}, {dd, d}, {ff, f}, {gg, g}}];
FindMinimum only finds a local minimum, where NMinimize can find unconstrained global minima :
{res, coes} = NMinimize[distance, {aa, bb, cc, dd, ff, gg}];
There are lots of ways to add a selection, this uses RadioButtonBar :
RadioButtonBar[Dynamic[rng], {Pi/2 -> "\[Pi]/2", 2 Pi -> "2\[Pi]"}]
The results should look like this :
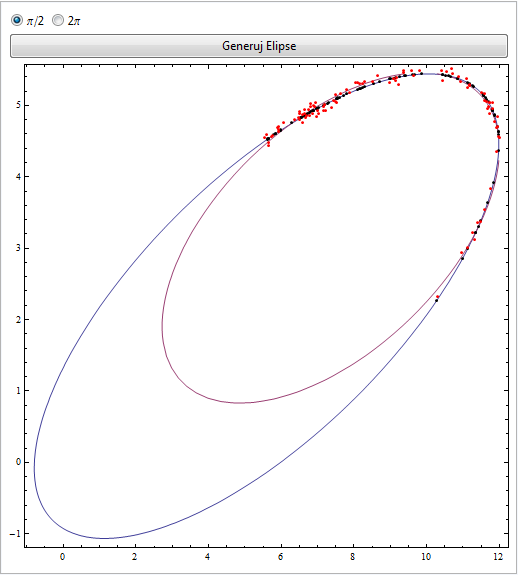
The code now looks like this :
Off[NMinimize::eit]; Off[NMinimize::lstol];
DynamicModule[{rng, final},
 Panel[Column[{
RadioButtonBar[
 Dynamic[rng], {Pi/2 -> "\[Pi]/2", 2 Pi -> "2\[Pi]"}],
Button["Generuj Elipse",
 While[True,(*Randomly choose coefficients until acceptable*)
  {a, b, c, d, f, g} = RandomReal[{-10, 10}, 6];
  \[CapitalDelta] = -c d^2 + 2 b d f - a f^2 - b^2 g + a c g;
  j = -b^2 + a c; i = a + c;
  If[\[CapitalDelta] != 0 && j > 0 && \[CapitalDelta]/i < 0,
   Break[]]];
 ellipse = a*x^2 + 2*b*x*y + c*y^2 + 2*d*x + 2*f*y + g;

 (*Center of an ellipse in general form is{(c d-b f)/(b^2-a c),(a f-b d)/(b^2-a c)}*)
 points = Table[theta = RandomReal[{0, rng}];
   ksol =
    FindRoot[(ellipse /. {x ->
          k*Cos[theta] + (c d - b f)/(b^2 - a c),
         y -> k*Sin[theta] + (a f - b d)/(b^2 - a c)}) == 0, {k,
      1.}];
   Point[{x, y}] /. {x -> k*Cos[theta] + (c d - b f)/(b^2 - a c),
      y -> k*Sin[theta] + (a f - b d)/(b^2 - a c)} /. ksol, {100}];
 nearpoints =
  points /.
   Point[{x_, y_}] :>
    Point[{x + RandomReal[{-.1, .1}], y + RandomReal[{-.1, .1}]}];
 (*ellipse x and y min and max values*)

 yplotrange =
  Flatten[{y, Sort[{(2*b*d - 2*a*f + Sqrt[(2*b*d - 2*a*f)^2 - 4*(b^2 - a*c)*(d^2 - a*g)])/(2*(-b^2 + a*c)),
             (-2*b*d + 2*a*f + Sqrt[(2*b*d - 2*a*f)^2 - 4*(b^2 - a*c)*(d^2 - a*g)])/(2*(b^2 - a*c))}]}];
 xplotrange =
  Flatten[{x, Sort[{(2*c*d - 2*b*f + Sqrt[(-2*c*d + 2*b*f)^2 - 4*(b^2 - a*c)*(f^2 - c*g)])/(2*(b^2 - a*c)),
             (-2*c*d + 2*b*f + Sqrt[(-2*c*d + 2*b*f)^2 - 4*(b^2 - a*c)*(f^2 - c*g)])/(2*(-b^2 + a*c))}]}];
 (*minimize distance of near points to a new general ellipse*)

 nearCoords = nearpoints[[All, 1]];
 {xs, ys} = Transpose[nearCoords];
 newellipse = aa*x^2 + 2*bb*x*y + cc*y^2 + 2*dd*x + 2*ff*y + gg;
 distance = Plus @@ (newellipse^2 /. {x -> xs, y -> ys});
 {res, coes} = NMinimize[distance, {aa, bb, cc, dd, ff, gg}];
 scaleup = FromDigits[{{1}, Last@RealDigits[1/(gg /. coes)] + 1}];
 esolve = Expand[scaleup*(newellipse /. coes)];

 final = Show[
   ContourPlot[{ellipse == 0, esolve == 0}, Evaluate[xplotrange],
    Evaluate[yplotrange]],
   Graphics[points], Graphics[{Red, nearpoints}],
   ImageSize -> {500, Automatic}];],

Dynamic@final
(*,Dynamic@Grid[Join[{{"points","nearby points"}},
Transpose[{points,nearpoints}][[All,All,1]]],
Frame\[Rule]All,Alignment\[Rule]Left]*)}]]
]


