Hello.
Thank you for your time helping me.
Unfortunately it is not working yet. Right now I cannot share the full code, since it is part of a working paper. However I'll try to share the maximum information that I can in order for you to be able to help me.
So, the code for the plot is this one:
FQ = Plot[{QBER}, {x, 0, NN}, PlotStyle -> {Thin, Black}, PlotLegends -> Placed[{"Expected QBER"}, {Right, Right}]];
Figt = ListPlot[{BLt, CUt}, Joined -> True, PlotStyle -> {Directive[Cyan, Thick], Directive[Magenta, Thick]}, PlotMarkers -> {{"\[FilledCircle]", 4}, {"\[FilledCircle]", 4}}, PlotLegends -> Placed[{"Expected \!\(\*SubscriptBox[\(QBER\), \(LB\)]\), Eq. \(7)", "Expected \!\(\*SubscriptBox[\(QBER\), \(UB\)]\), Eq. (8)"}, \{Right, Right}]];
FLB = ListPlot[{Transpose[{x[NN], AQ}], Transpose[{x[NN], BL}]}, Filling -> {1 -> {2}}, PlotMarkers -> {{"\[FilledCircle]", 4}, {"-", 12}}, PlotStyle -> {Blue, Red}, PlotLegends -> Placed[{"\!\(\*OverscriptBox[\(QBER\), \(^\)]\)", "\!\(\*SubscriptBox[\(QBER\), \(LB\)]\), Eq. (7)"}, {Right, Right}]];
FUB = ListPlot[{Transpose[{x[NN], AQ}], Transpose[{x[NN], CU}]}, Filling -> {2 -> {1}}, PlotMarkers -> {{"\[FilledCircle]", 4}, {"-", 12}}, PlotStyle -> {Blue, Green}, PlotLegends -> Placed[{"\!\(\*OverscriptBox[\(QBER\), \(^\)]\)", "\!\(\*SubscriptBox[\(QBER\), \(UB\)]\), Eq. (8)"}, {Right, Right}]];
gg = Plot[{Eq9[QBER, i], Eq10[QBER, i]}, {i, 0, NN}, PlotStyle -> {Red, Green}, PlotLegends -> Placed[{"\!\(\*SubscriptBox[\(QBER\), \(LB\)]\), Eq. (9)", "\!\(\*SubscriptBox[\(QBER\), \(UB\)]\), Eq. (10)"}, {Right, Right}]];
Show[Figt, FUB, FLB, FQ, gg, PlotRange -> {-0.01, 0.2}, AxesLabel -> {"\!\(\*SubscriptBox[\(N\), \(w\)]\)", "\!\(\*OverscriptBox[\(QBER\), \(^\)]\)"}];
What I get from this code is the following:
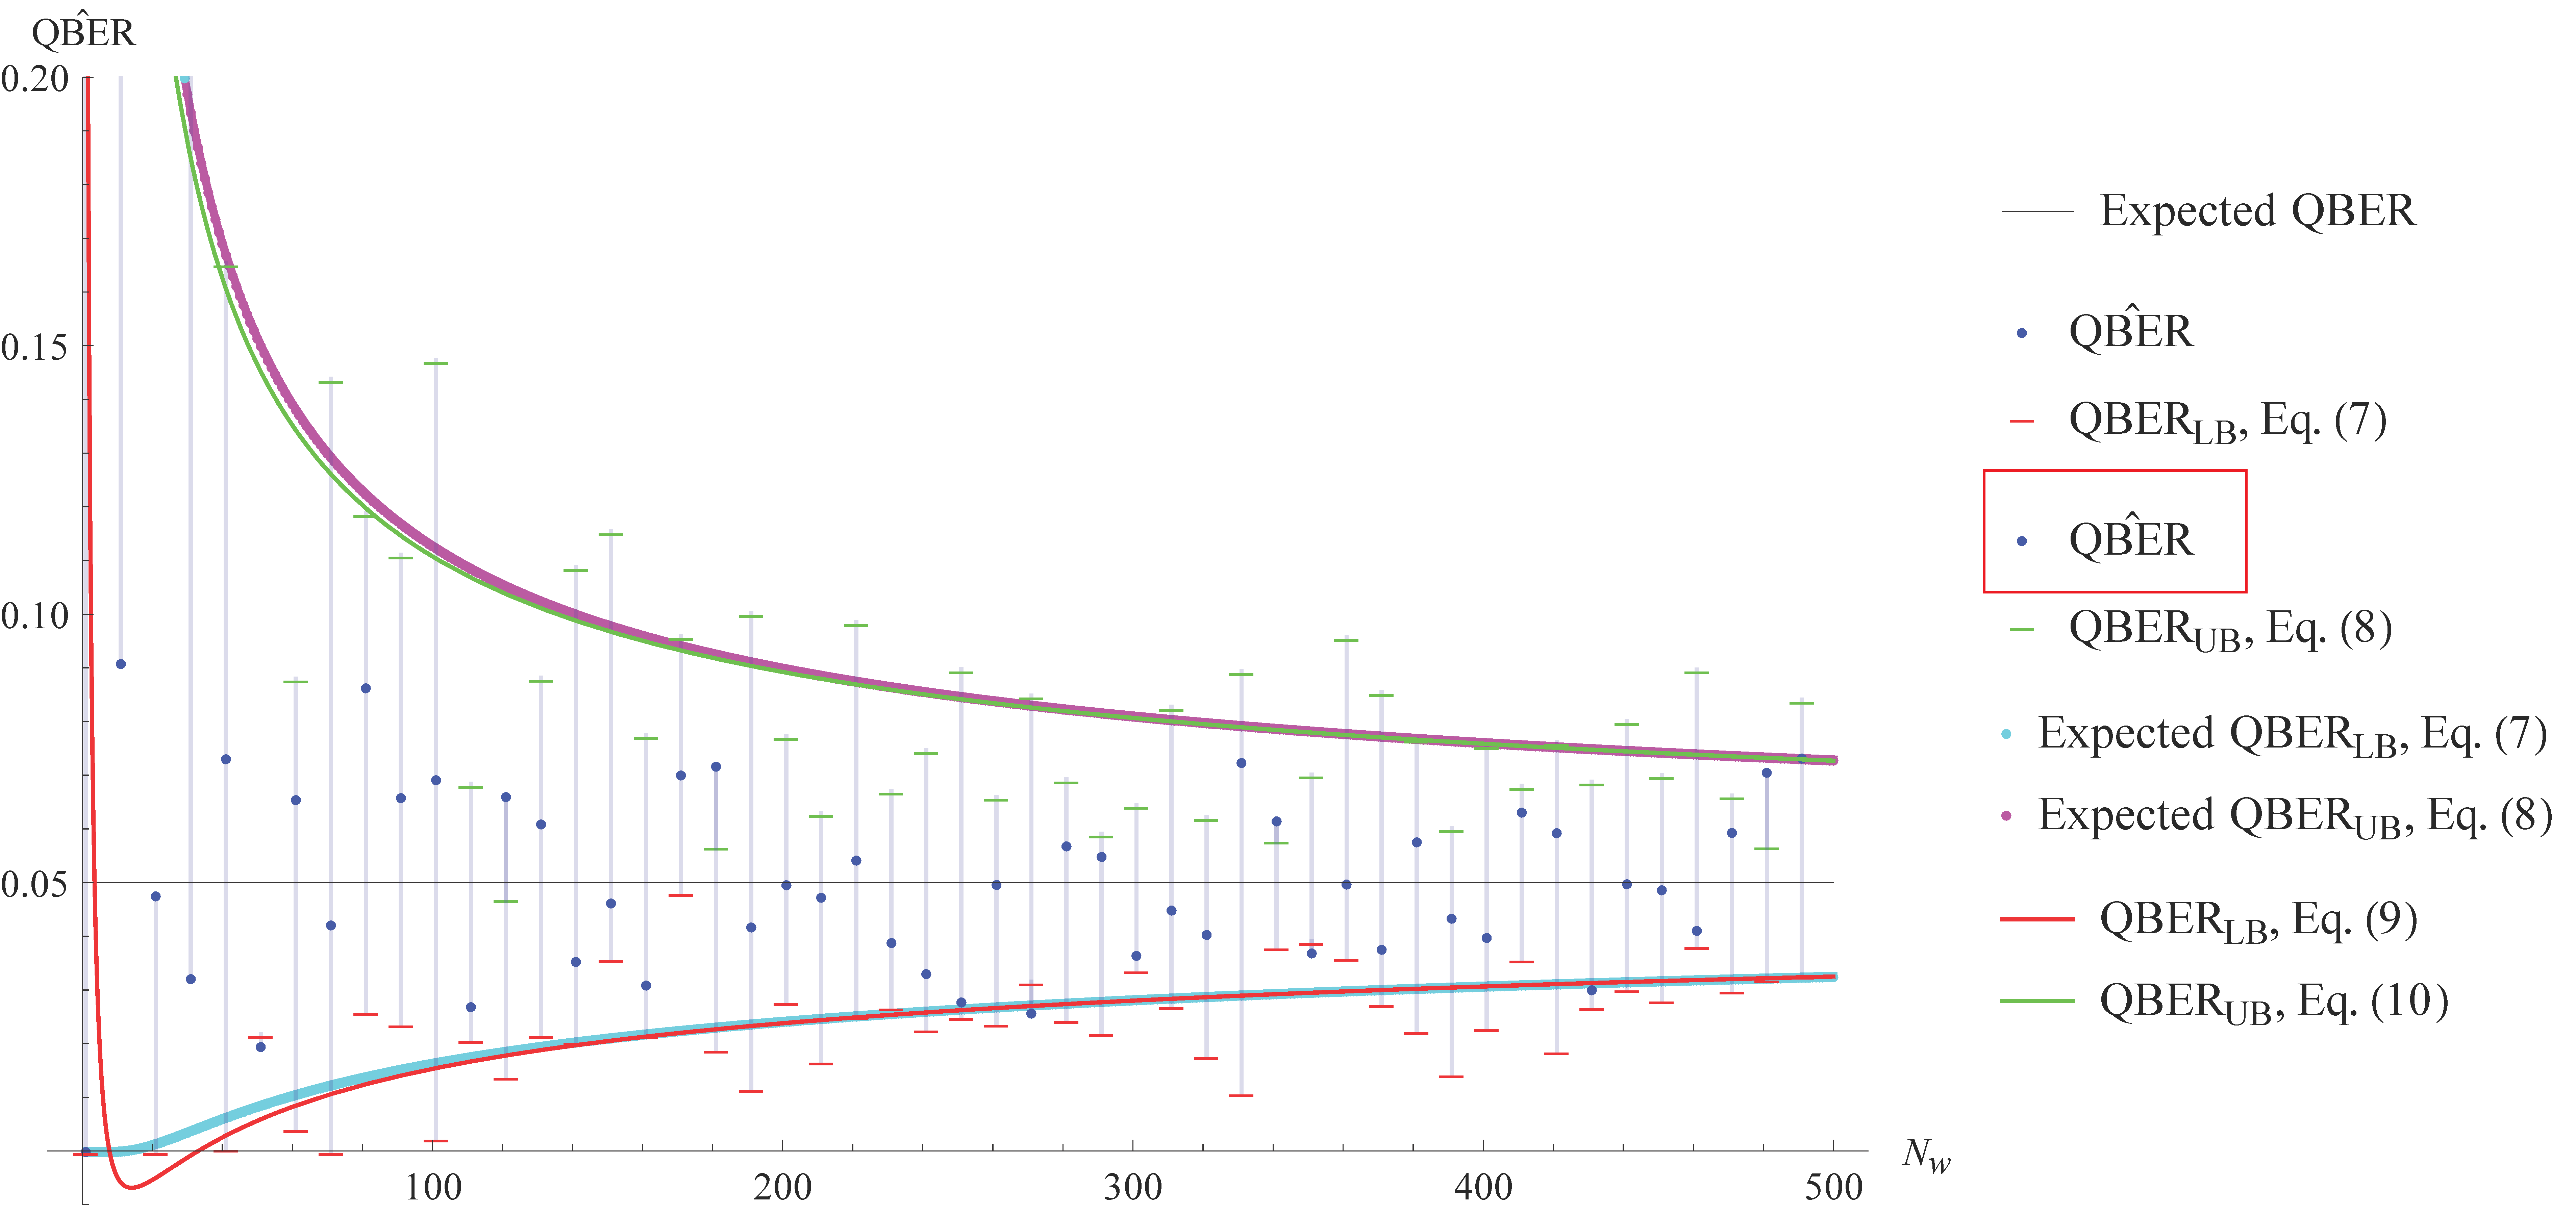
and you can see the fourth line of the legend is equal to the second (inside the red box).
However if I use what you suggest and which I have tryed before I get the following:
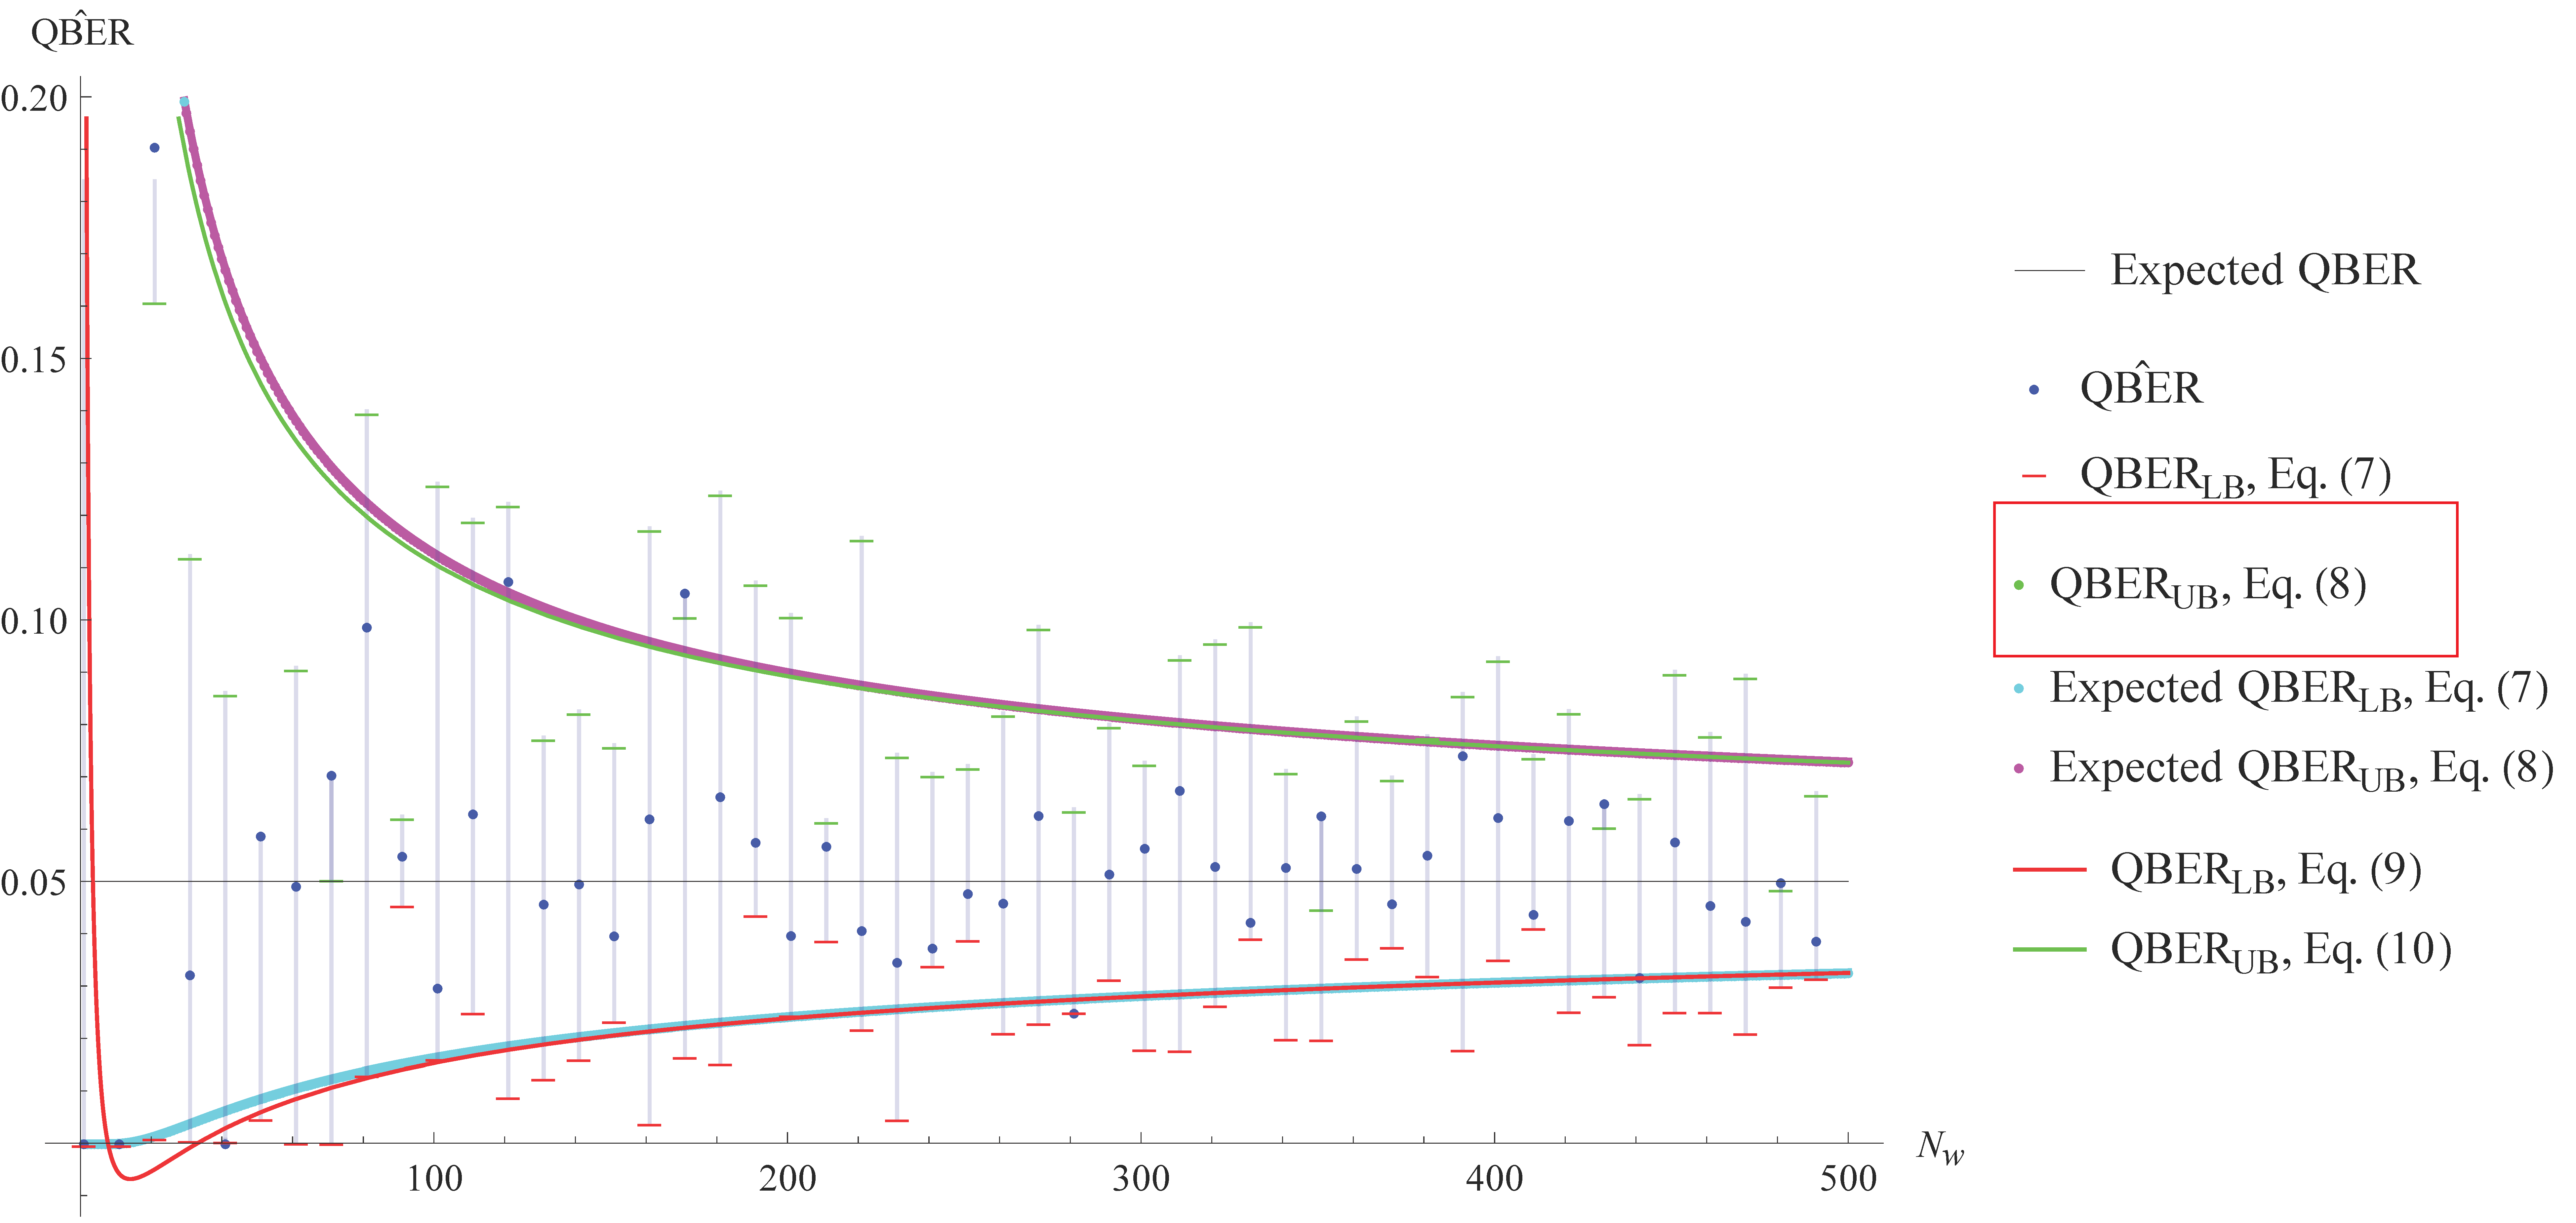
As you can see inside the repeated legend is now longer there, however I have another problem, which is: the plot mark is a dot instead of a dash. The only thing that I changed was "\!\(\*OverscriptBox[\(QBER\), \(^\)]\)" to None in FUB. How did he changed the dash to dot? How can I get the dash is it is plotted?
So, this is the main problem that I have here. Based on what I just provided, can you find a solution for it?


