Message Boards Message Boards

3
|
14502 Views
|
6 Replies
|
7 Total Likes
View groups...
Share
Share this post:

Issues with Mathematica 10 and LogPlot grid lines

Posted 10 years ago

So, today I updated Mathematica 9 to 10 and tried a few .nb I made for the older version to check the differences, but I found some issues in one notebook.

P1 = LogPlot[8/(3 Sqrt[2]*Pi)*(1/x - 1)^(5/2), {x, 0, 1}, PlotRange -> {{0, 1}, {10^-3, 10}}, GridLines -> {{0, 0.1, 0.2, 0.3, 0.4, 0.5, 0.6, 0.7, 0.8, 0.9, 1}, Automatic}, AxesLabel -> {Style[\[Xi], Large], Style[\[Eta], Large]}, Ticks -> {{0, 0.1, 0.2, 0.3, 0.4, 0.5, 0.6, 0.7, 0.8, 0.9, 1}, {0.001, 0.01, 0.1, 1, 10}}, PlotStyle -> {Blue}]

P2 = ListLogPlot[{{0.60302, 0.1284}, {0.85427, 0.01427}, {0.3015, 0.57068}}, PlotStyle -> {Magenta}]

P3 = ListLogPlot[{{0.80402, 0.01298}, {0.60302, 0.0881}, {0.2010, 0.5509}}, PlotStyle -> {Darker[Green]}]

P4 = LogPlot[1, {x, 0, 1}, PlotStyle -> {Red} ]

Needs["ErrorBarLogPlots`"]

P5 = ErrorListLogPlot[{{{0.60302, 0.1284}, ErrorBar[0.002829]}, {{0.85427, 0.01427}, ErrorBar[0.0001189]}, {{0.3015, 0.57068}, ErrorBar[0.003303]}}, PlotStyle -> {Magenta}]

P6 = ErrorListLogPlot[{{{0.80402, 0.01298}, ErrorBar[0.0001198]}, {{0.60302, 0.0881}, ErrorBar[0.001571]}, {{0.2010, 0.5509}, ErrorBar[0.005911]}}, PlotStyle -> {Darker[Green]}]

Show[{P1, P2, P3, P4, P5, P6}]

The final graphic looked like this in Mathematica 9:
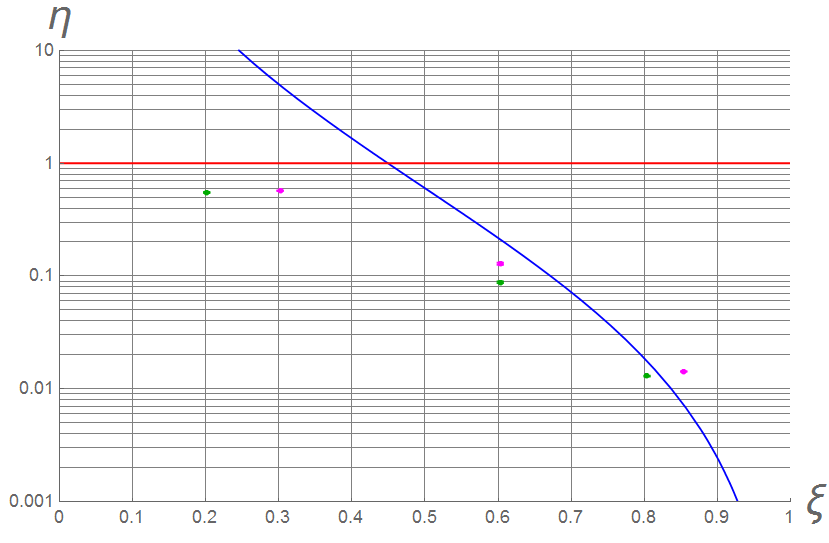
enter image description here

For the same code, now it looks like this:
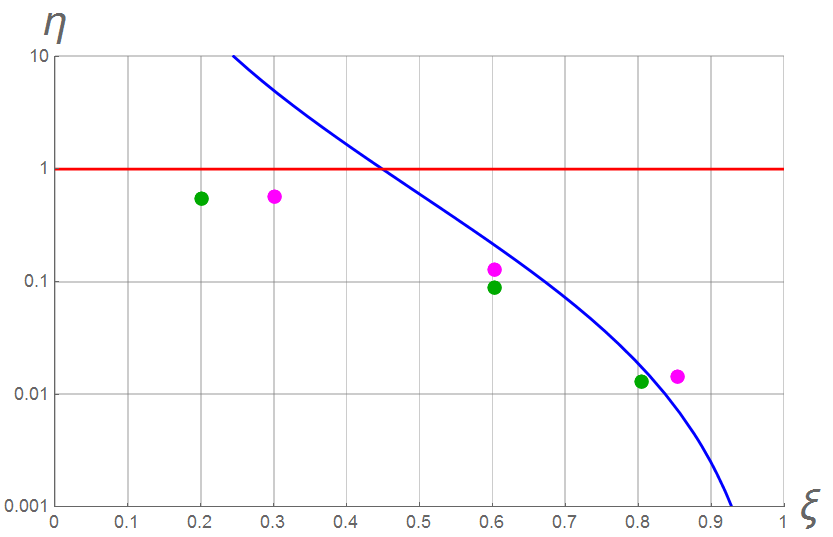
enter image description here

I fixed the grid disappearance manually defining it:

P1 = LogPlot[8/(3 Sqrt[2]*Pi)*(1/x - 1)^(5/2), {x, 0, 1}, PlotRange -> {{0, 1}, {10^-3, 10}}, GridLines -> {{0, 0.1, 0.2, 0.3, 0.4, 0.5, 0.6, 0.7, 0.8, 0.9,1}, {10^-3*2, 10^-3*3, 10^-3*4, 10^-3*5, 10^-3*6, 10^-3*7, 10^-3*8, 10^-3*9, 10^-2, 10^-2*2, 10^-2*3, 10^-2*4, 10^-2*5, 10^-2*6, 10^-2*7, 10^-2*8, 10^-2*9, 10^-1, 10^-1*2, 10^-1*3, 10^-1*4, 10^-1*5, 10^-1*6, 10^-1*7, 10^-1*8, 10^-1*9, 1, 2, 3, 4, 5, 6, 7, 8, 9, 10}}, AxesLabel -> {Style[\[Xi], Large], Style[\[Eta], Large]}, Ticks -> {{0, 0.1, 0.2, 0.3, 0.4, 0.5, 0.6, 0.7, 0.8, 0.9, 1}, {0.001, 0.01, 0.1, 10^0, 10}}, PlotStyle -> {Blue}]

Is there a better way to show the logarithmic grid without defining every single line manually?

By the way, for the size of the points I added PlotStyle -> {PointSize[0.003]} to ListLogPlot and ErrorListLogPlot and apparently that worked: enter image description here
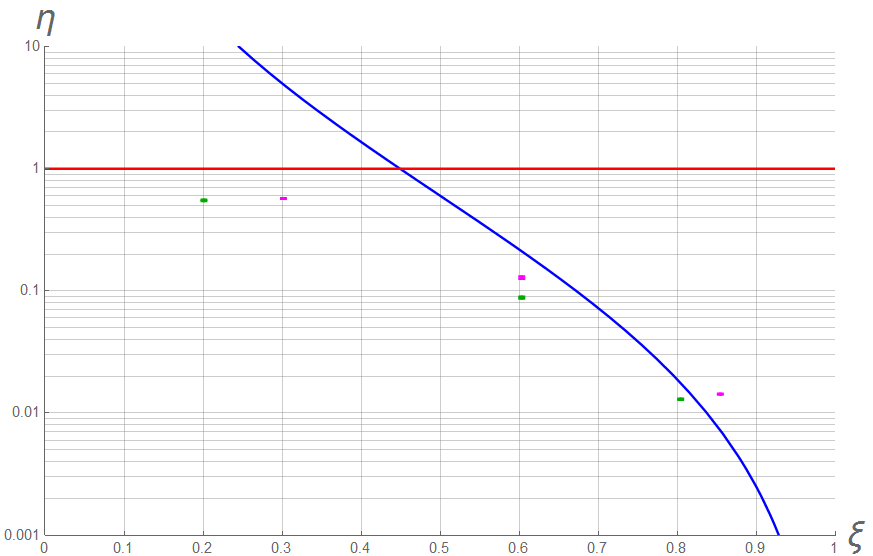
Thank you very much and sorry if my english it's not perfect.

POSTED BY: F. Ríos
6 Replies

Hi all,

well, yes: There should be gridlines on more than just on the major divisions.

But isn't the solution as simple as:

GridLines -> {Automatic, Flatten[(Range[9] 10^#) & /@ Range[-4, 0]]}

Regards Henrik

POSTED BY: Henrik Schachner
Posted 10 years ago

I would really like to see a PlotTheme "Engineering." Engineers often use graphs for more than publication: as working documents for design, and to read values from them.

I suggest the following:

1) Plots are framed.

2) PlotLegends are available.

3) For linear axes, ticks and grid lines are as usual.

4) For log axes:

a) Major ticks and grid lines if automatic are always on the decades.

b) If there is room, minor ticks and grid lines are drawn on the usual 1 through 9 sub-decade divisions.

c) 1 through 9 subdivisions are NEVER spread across more than a decade. If there isn't room to place them in each decade, then they should not be drawn.

d) Major divisions are labeled with the appropriate 10^n label, but if it becomes crowded these labels may be reduced to a fraction of the major divisions. But major divisions always occur at each decade regardless.

I think such plots would be useful for many engineers.

Best regards, David

POSTED BY: David Keith

Look up the PlotTheme option and the $PlotTheme global variable. Especially PlotTheme->"Classic", which probably gives what you want.

POSTED BY: Bruce Miller
Posted 10 years ago

I get the same gridline behavior with or without PlotTheme->"Classic" in V10.

POSTED BY: Ted Cook
Posted 10 years ago
POSTED BY: Ted Cook
Posted 10 years ago

I would also like improvement in this. A simple LogPlot in V9 with GridLines -> Automatic puts lines at majors division on the x-axis and major and minor divisions on the Y (log) axis.

In V10 we get GridLines on major divisions only on both axes.

V10 probably makes more sense, but I would really like to have more control without having to explicitly generate lines. I suggest the options for GridLines be expanded to None, Automatic or All, where All would place GridLines at every axis tick. Since these could be used as GridLines->{Automatic, All} the behavior of V9 could be reacquired at need.

--David

POSTED BY: David Keith
Reply to this discussion
Community posts can be styled and formatted using the Markdown syntax.
Reply Preview
Attachments
Remove
or Discard

Group Abstract Group Abstract