Dear Bob,
I could't immediately make it work on Wolfram Alpha. But if you need the figure the following could work. You sign up for a free (!) account for the Wolfram Programming Cloud:
http://www.wolfram.com/programming-cloud/pricing/
It runs the Wolfram Language and you can achieve what you want by opening a new notebook and typing:
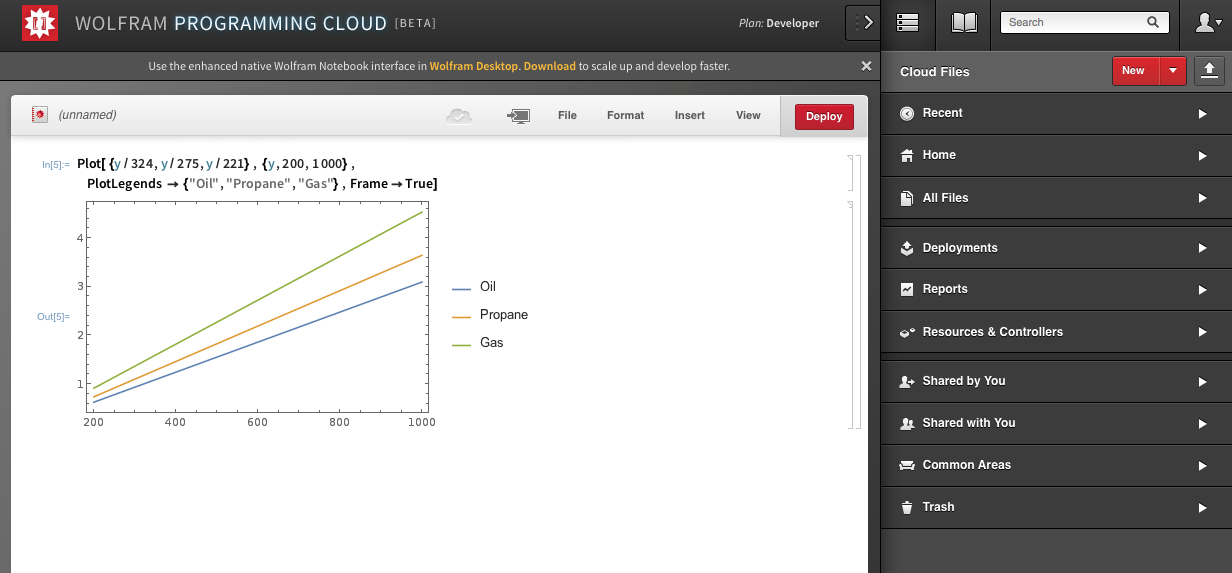
Plot[{y/324, y/275, y/221}, {y, 200, 1000},PlotLegends -> {"Oil", "Propane", "Gas"},Frame-> True]
You should see something like this
The Wolfram Cloud is more powerful than Wolfram Alpha alone - it can make W|A requests. You get a whole lot of functionality for free. It gives you a great deal of flexibility of how to format the output.
Cheers,
Marco


