Message Boards Message Boards

Bárðarbunga earthquake swarm

Posted 10 years ago
POSTED BY: Arnoud Buzing
6 Replies
Posted 10 years ago
POSTED BY: Jaebum Jung

Very nice, indeed!

Would it be possible to animate this map so that the earthquakes pop up over time?

Yes, using the techniques described above but saving image for every minute: https://vimeo.com/104637028

And how to generate the animation.

POSTED BY: Arnoud Buzing

This is truly great - thanks for posting!

The Wikipedia page says:

Seismic activity surrounding the Bárðarbunga volcano has been gradually increasing since 2007 with a brief respite during the eruption at Grímsvötn in 2011. Activity has now (2014) reached a level similar to that just before the Grímsvötn eruption.

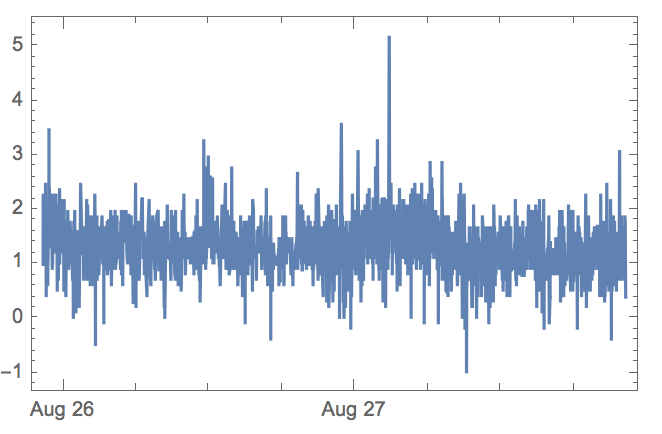
Is it possible to plot time series of average magnitude of the earthquakes since 2007? I tried but data seem to include just few last days:

DateListPlot[
 Transpose[
  {Normal[dataset[All, {"timestamp", "size"}]][[All, 1]],
   Normal[dataset[All, {"timestamp", "size"}]][[All, 2]]}
  ],
 PlotRange -> All]

enter image description here

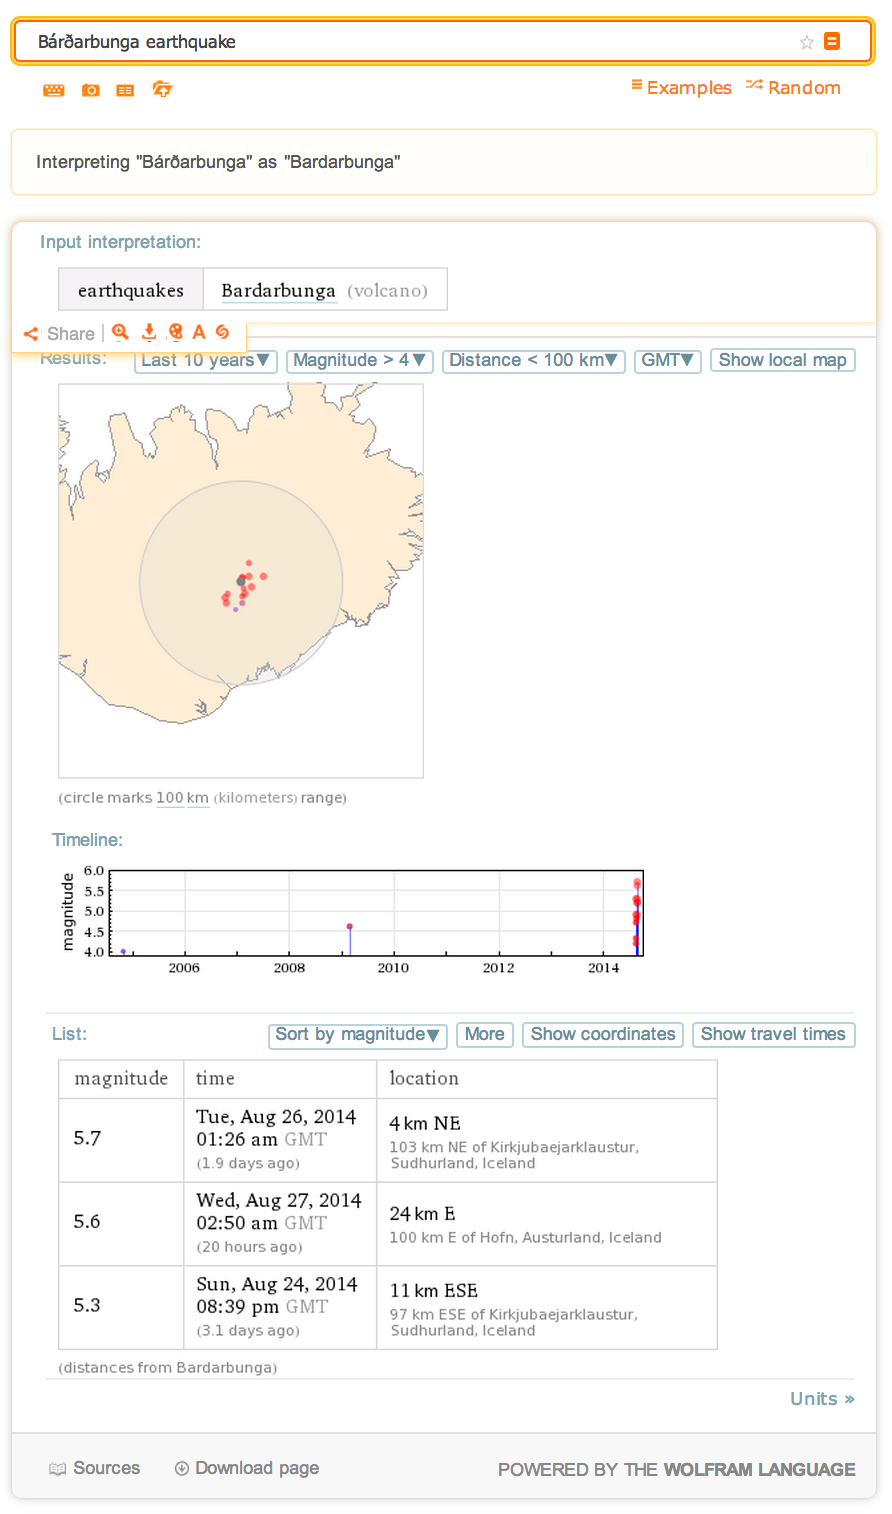
Also - shouldn't Wolfram Alpha has all these data too somehow? I do not see this "gradually increasing since 2007"

enter image description here

POSTED BY: Sam Carrettie
Posted 10 years ago

And Double-Wow!

POSTED BY: David Keith

Wow!

POSTED BY: Marco Thiel
Reply to this discussion
Community posts can be styled and formatted using the Markdown syntax.
Reply Preview
Attachments
Remove
or Discard

Group Abstract Group Abstract