Triggered by the recent outbreak of Ebola India Bruckner, a pupil from Aberdeen's St Margaret's School for Girls, and myself worked on a little model this summer to understand the basics of the spreading of diseases in populations and the relationship to transportation networks. The model is very basic, but shows some interesting features and is very straight forward to implement in Mathematica.
When I was typing these lines I saw that Arnoud Buzing had posted something, reason enough to interrupt my typing and to check out what he had posted: Visualizing the Ebola Outbreak. I hope that my post is going to complement Arnoud's to some extent.
So, my question is how the global air transport network might lead to a spreading of a disease. I will use a very standard SIR (susceptible-infected-recovered) model, which is certainly far from being ideal for Ebola; but similar types of models are to too bad either. It rather simulates an outbreak of some generic disease from which you recover. If we assumed that everyone died in an outbreak the SIR model might also be appropriate. I will introduce the equations below. I also need a list of all airports and all flight connections. On the website Openflights.org you will find all data we need. I saved the file "airports.dat" and the file "routes.dat". So that's the data.
I first import the data:
airports = Import["~/Desktop/airports.dat", "CSV"];
routes = Import["~/Desktop/routes.dat", "CSV"];
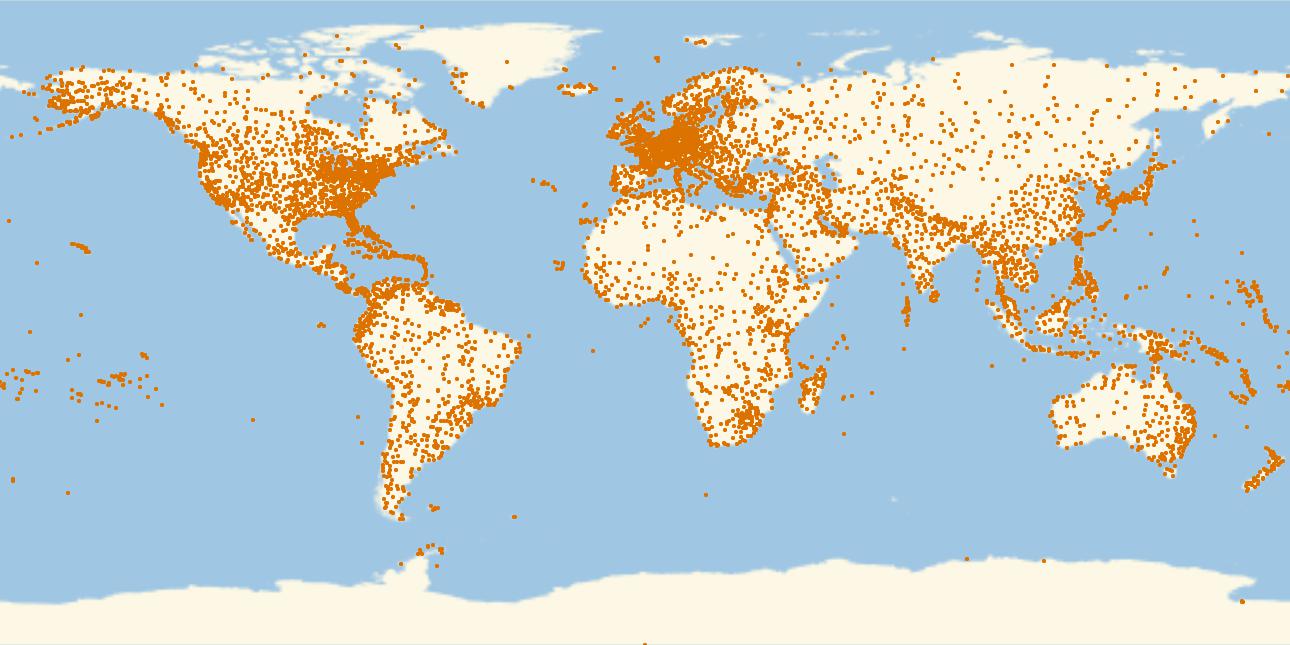
This is a plot of all airports in that database.
GeoRegionValuePlot[Table[GeoPosition[airports[[i, {7, 8}]]] -> 1., {i, 1, Length[airports]}], PlotStyle -> PointSize[0.003], PlotRange -> 1, ImageSize -> Full]
which gives
Alright, now the routes. First, we create a list of rules for all airport IDs and their coordinates:
codecoords = Table[airports[[i, 5]] -> GeoPosition[airports[[i, {7, 8}]]], {i, 1,Length[airports]}];
We then calculate the links:
links = Monitor[Table[routes[[j, {3, 5}]] /. codecoords, {j, 1, Length[routes]}], ProgressIndicator[j, {1, Length[routes]}]];
and clean out missing data:
linksclean = Select[links, Head[#[[1]]] == GeoPosition && Head[#[[2]]] == GeoPosition &];
Now comes a nice figure:
With[{locations = RandomChoice[linksclean, 14000]}, GeoGraphics[{{Green, Opacity[0.3],AbsoluteThickness[0.0001], GeoPath[locations, "Geodesic"]}},
  GeoRange -> "World", GeoProjection -> Automatic, GeoBackground -> GeoStyling["ReliefMap"], ImageSize -> {1200, 600}]]
which gives
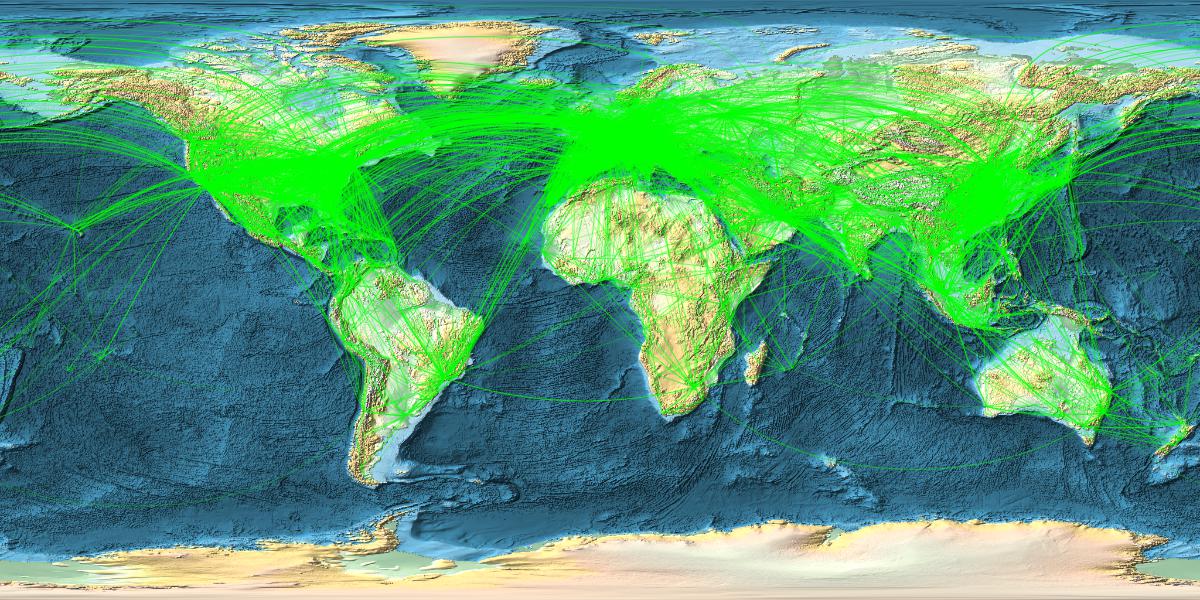
Ok. Interestingly I can only plot 16000 max at a time. Somewhere between 16-17k the Kernel quits. That might be Integer related. Could be a limit in the programming of Geographics. Not sure. I have more than enough memory and can plot the remaining 2-3k airports in a second figure and use Show to display all. (It would be great if someone from WRI could comment.)
Anyway, let's go to some modelling. The basic idea of an SIR model is that a population is modelled in three compartments Susceptibles (S), Infected (I) and Recovered (R). I will use a time-discrete model; there are continuous models around, too, and if anyone is interested I can provide the ODE model as well. Here are the three equations:
sus[i_] := sus[i] = sus[i - 1] - [Rho] sus[i - 1] inf[i - 1];
inf[i_] := nf[i] = inf[i - 1] + [Rho] sus[i - 1] inf[i - 1] - [Lambda] inf[i - 1];
rec[i_] := rec[i] = rec[i - 1] + [Lambda] inf[i - 1];
The meaning of sus, inf and rec should be clear by now; they are given as percentages of the total population, their sum is 100%. The variable i represents time. $ ho$ is an infection rate and $lambda$ is a recovery rate. The infections increase with the product of susceptibles and infected. By adding the right hand sides it becomes clear that the population does not change over time. We come up with some values for the parameters and iterate:
sus[1] = 0.95; inf[1] = 0.05; rec[1] = 0; [Rho] = 0.2; [Lambda] = 0.1;
tcourse = Table[{sus[i], inf[i], rec[i]}, {i, 1, 100}];
The time course looks like this:
ListPlot[Transpose[tcourse]]
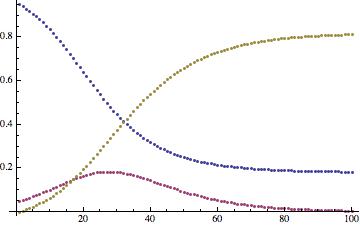
The monotonously decreasing function show susceptibles, the increasing function recovered, and the remaining curve the infected. We now need to do some cleaning up of the original airport data, before we proceed to a multi-airport/city model.
(*Extract the names and GPS coordinates*)

rawdata =
  Sort[Select[airports[[All, {5, 7, 8}]], #[[1]] != "" &]][[81 ;;]];

(*These are just the coordinates*)

airportcoords = rawdata[[All, {2, 3}]];

(*These are just the names. *)

names = rawdata[[All, 1]];

(*Here are the names to indices*)

rules = MapThread[#1 -> #2 &, {names, Range[Length[names]]}];

(*The "population" is initially set to 1 for all airports, this allows us to take different airport sizes into consideration later.*)

pop = Table[1., {j, 1, Length[names]}];
routesraw = Import["~/Desktop/routes.dat", "CSV"];

(*There are many links so this takes a while*)

links = Select[routesraw[[All, {3, 5}]] /. rules, NumberQ[#[[1]]] && NumberQ[#[[2]]] &];
From that we now construct (a first guess at) the coupling or adjacency matrix:
couplingdummy = Table[0, {i, 1, Length[names]}, {j, 1, Length[names]}];

For[k = 1, k <= Length[links], k++,
  couplingdummy[[links[[k, 1]], links[[k, 2]]]] = 1;
  couplingdummy[[links[[k, 2]], links[[k, 1]]]] = 1];
I do know about ConstantArray, but for some reason that does not work. The first line constructs a matrix full of zeros and the second adds ones where there are links. The problem is that apparently in that dataset some airports are not linked at all. We can sort them out by:
indices = Select[Table[If[Total[couplingdummy[[i]]] > 0, i], {i, 1, Length[couplingdummy]}], NumberQ];
We now delete the columns and rows of the couplingdummy matrix
intermed = couplingdummy[[#]] & /@ indices;
transintermed = Transpose[intermed];
coupling = transintermed[[#]] & /@ indices;
Again I had a much more elegant way of doing this, with the advantage that it did not work. To speed up the following calculations I use that the coupling matrix is sparse, but I like the original too much to throw it away just yet.
coulinginterm = coupling;
coupling = SparseArray[coulinginterm];
We adapt our "population/airport size" vector:
pop = Table[1., {j, 1, Length[indices]}];
and set the following parameters:
[Rho] = 0.2; [Lambda] = 0.1; Mairports = Length[indices]; [Mu] = 0.05;
$\rho$ and $lambda$ are as before. Mairports is the number of airports that we model and $\mu$ is a "migration rate". It comes from the original model which we built for different cities were it describes the migration between different cities. Here is models the "propensity to fly".
We now define an effective coupling matrix. It is the adjacency matrix times the population vector (i.e. people in the catchment area of the airport). In our case the vector has all ones, so it is just the adjacency matrix. It allows us later to model more general situations.
meanNN = coupling.pop;
When we want to model the outbreak as populations at the positions of all airports, each of which is described by an SIR model, we need to couple lots of populations, because there are lots of airports. The following uses the sparsity of the adjacency matrix to speed up the calculation.
sumind = Table[Take[Flatten[ArrayRules[coupling[[k, All]]][[All, 1]]], Length[ArrayRules[coupling[[k, All]]]] - 1], {k, 1, Mairports}];
It generates a list of all airports that are coupled/linked to a given airport. Now we are ready to write down the central equations:
sus[i_, j_] :=  sus[i, j] = (1 - [Mu]) (sus[i - 1, j] - [Rho] sus[i - 1, j] inf[i - 1, j]) + [Mu]  Total[Table[sus[i - 1, sumind[[j, u]]]*pop[[sumind[[j, u]]]], {u, 1, Length[sumind[[j]]]} ] ]/meanNN[[j]];
inf[i_, j_] := inf[i, j] = (1 - [Mu]) (inf[i - 1, j] + [Rho] sus[i - 1, j] inf[i - 1, j] - [Lambda] inf[i - 1, j]) + [Mu] Total[Table[inf[i - 1, sumind[[j, u]]]*pop[[sumind[[j, u]]]], {u, 1, Length[sumind[[j]]]} ] ]/meanNN[[j]];
rec[i_, j_] := rec[i, j] = (1 - [Mu]) (rec[i - 1, j] + [Lambda] inf[i - 1, j]) + [Mu] Total[Table[rec[i - 1, sumind[[j, u]]]*pop[[sumind[[j, u]]]], {u, 1,Length[sumind[[j]]]} ] ]/meanNN[[j]];
The terms with the Total are "migration terms" that describe the travelling behaviour of the people in the catchment area of the airports. i is the time index and j labels the airports. Next come the initial conditions:
For[i = 1, i <= Mairports, i++, sus[1, i] = 1.; inf[1, i] = 0.0;  rec[1, i] = 0.;]
sus[1, 1] = 0.95;
inf[1, 1] = 0.05;
rec[1, 1] = 0.0;
In the catchment areas of all airports there are only susceptibles, apart from airport number 1, which will have 5% infected people. Now we can finally iterate the whole thing:
tcourse = Monitor[Table[{sus[i, j], inf[i, j], rec[i, j]}, {i, 1, 500}, {j, 1,Mairports}], ProgressIndicator[i, {0, 500}]];
Great. Let's save that just in case your notebook tends to crash at this point, just l like mine did when I was playing with this.
Export["~/Desktop/SIR-tcourse.csv", tcourse];
If you wish you can now plot the time course of some of the airport catchment areas:
ListPlot[Flatten[Table[{tcourse[[All, j, 1]], tcourse[[All, j, 2]], tcourse[[All, j, 3]]}, {j, 1, 200}], 1], ImageSize -> Large]
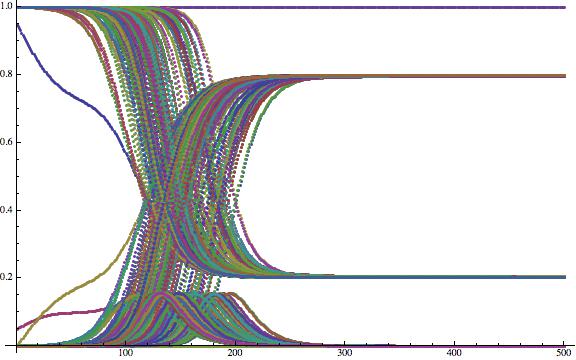
Now that is not very helpful yet. To generate nicer plots, i.e. to normalise, we first calculate the maximal number of sick people at any of the airports:
maxsick = Max[Flatten[tcourse[[All, All, 2]]]];
We then generate movie frames, and go and get some coffee....
frames = Monitor[Table[GeoRegionValuePlot[Table[GeoPosition[airportcoords[[indices[[i]]]]] -> inf[k, i]/maxsick, {i, 1, Length[indices]}], PlotStyle -> PointSize[0.003], PlotRange -> 1, ImageSize -> Full,ColorFunction -> "Rainbow"], {k, 1, 300}], ProgressIndicator[k, {0, 300}]];
Actually, you might want to get another coffee when you want to export the frames:
Export["~/Desktop/SIR-frames-World.gif", frames];
Alright. That gif is a bit large to embed it into this post, but you can download it from here. All I can do is show you some frames to get an idea of how this looks:
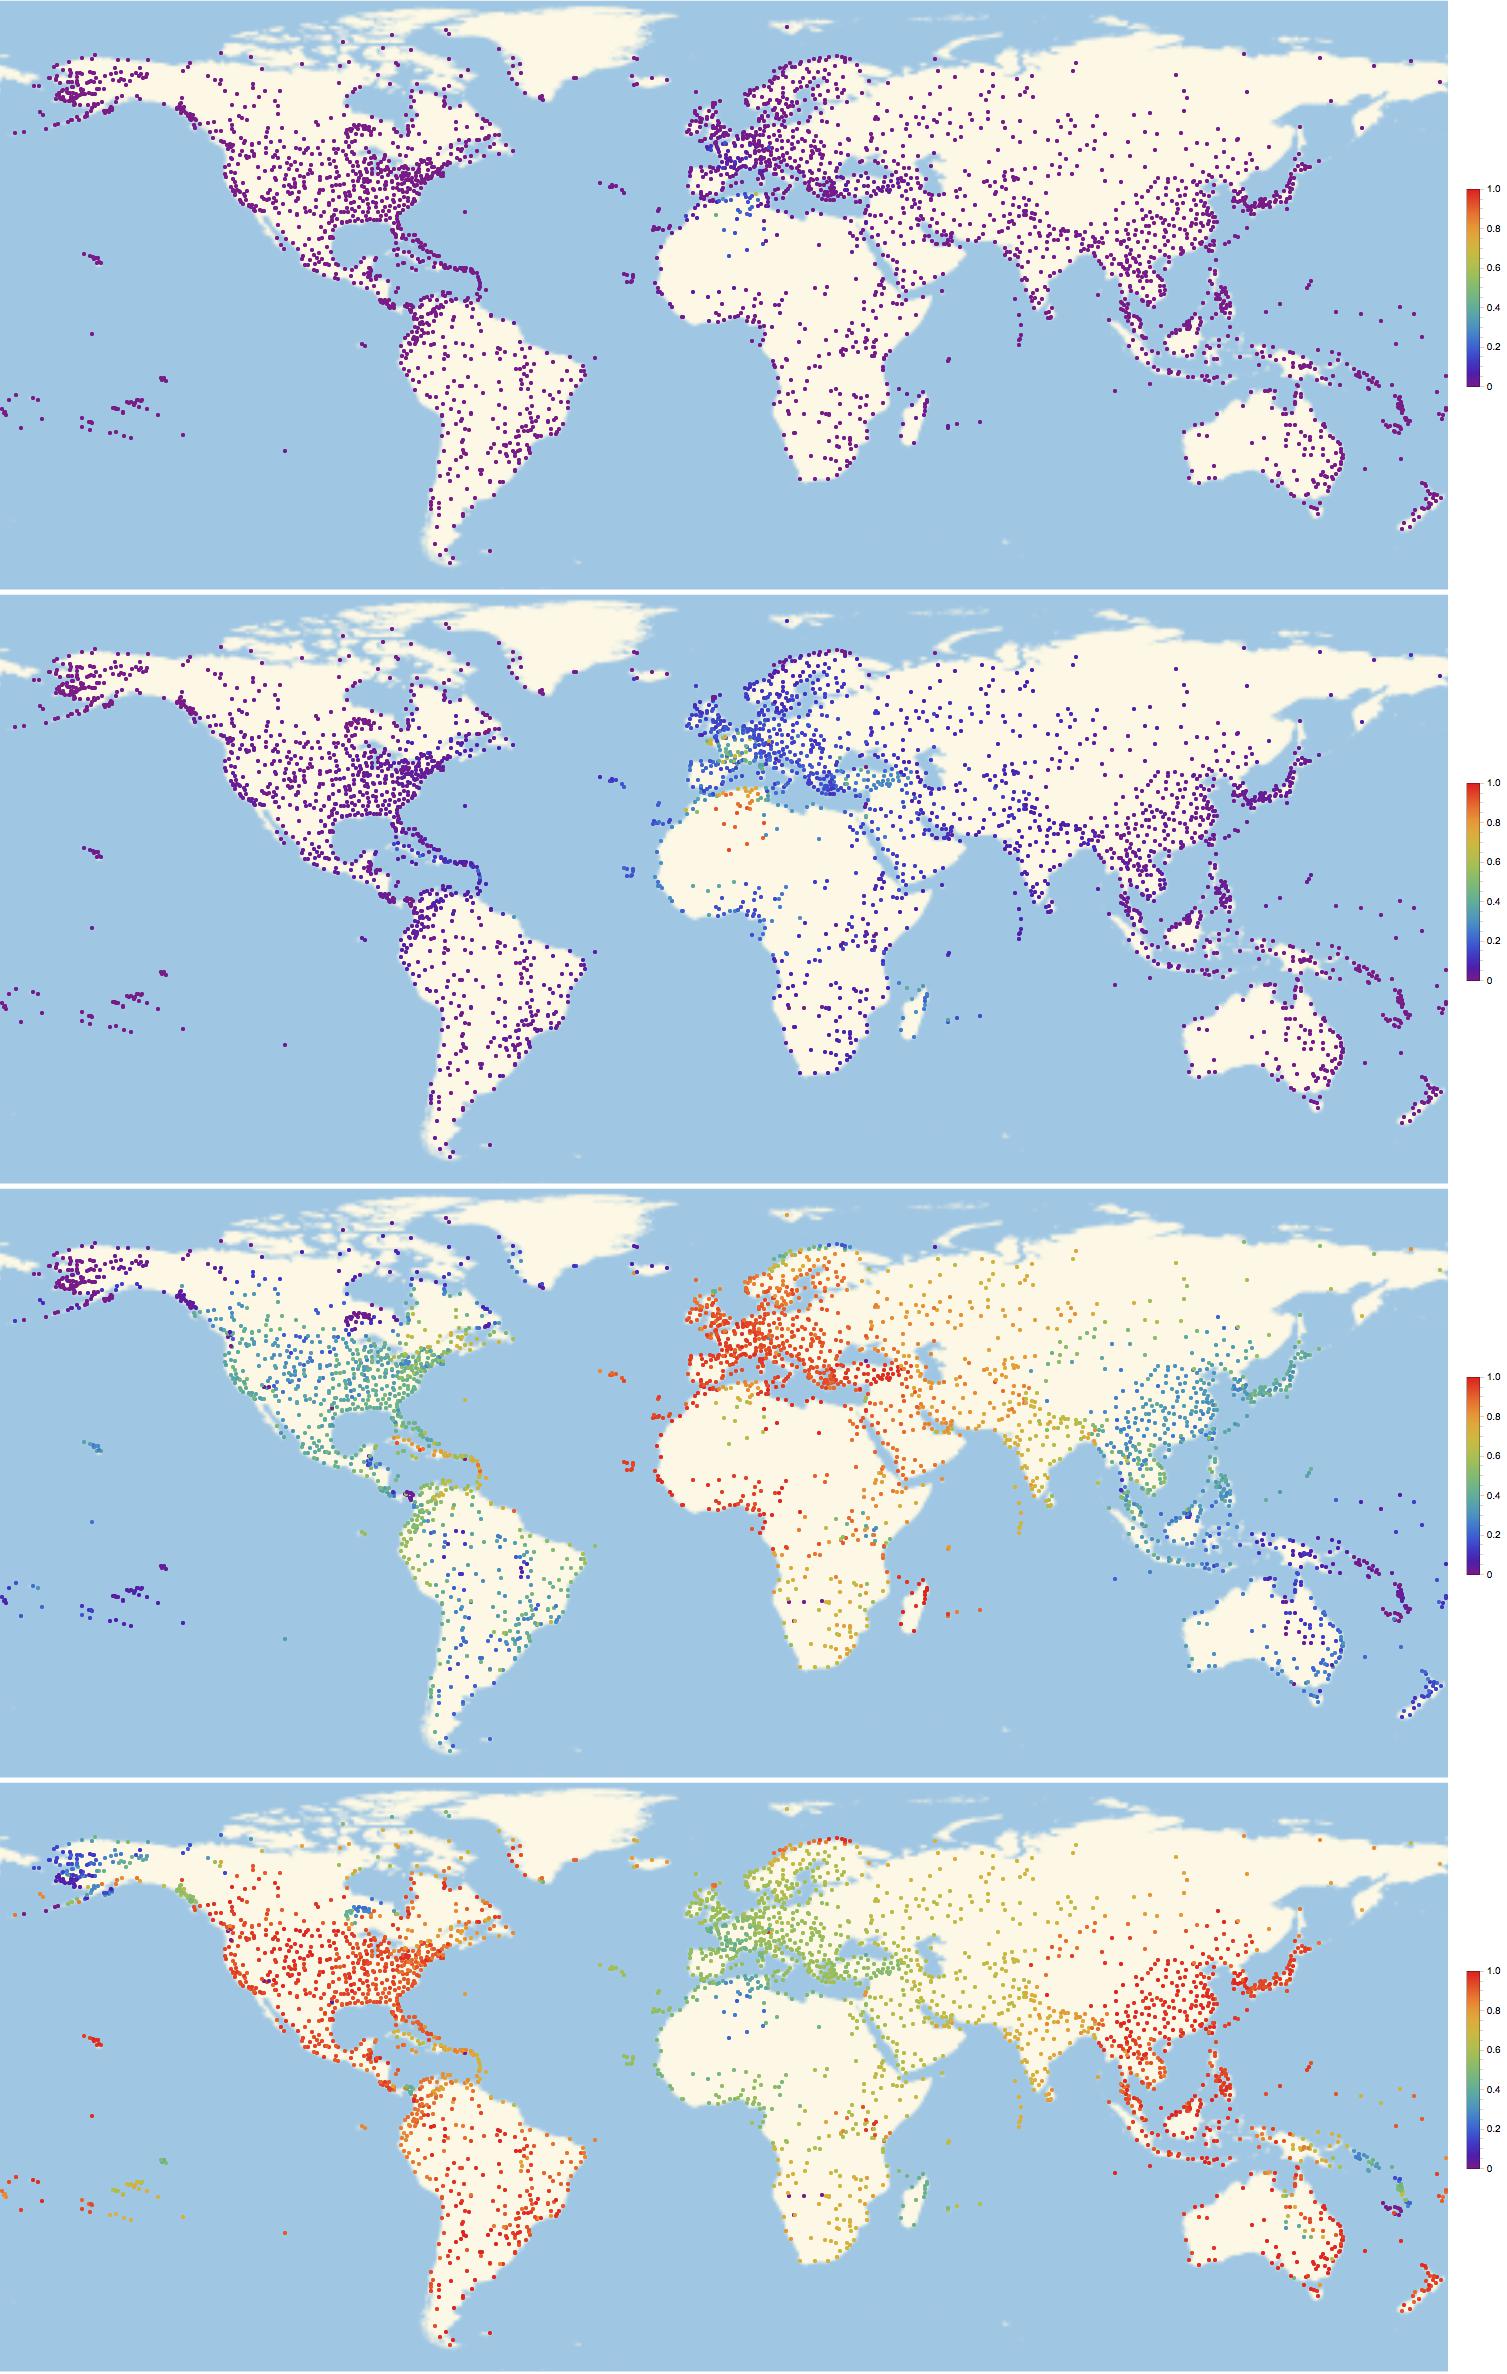
Of course we can look at the network structure and try to understand the pattern of infections. This command is useful:
CommunityGraphPlot[AdjacencyGraph[Normal[coupling]]]
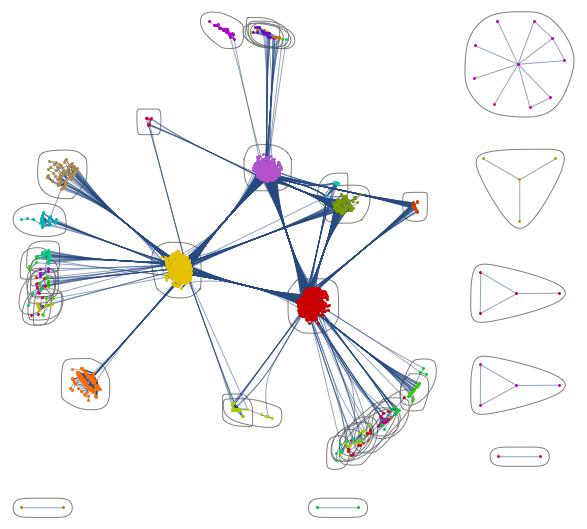
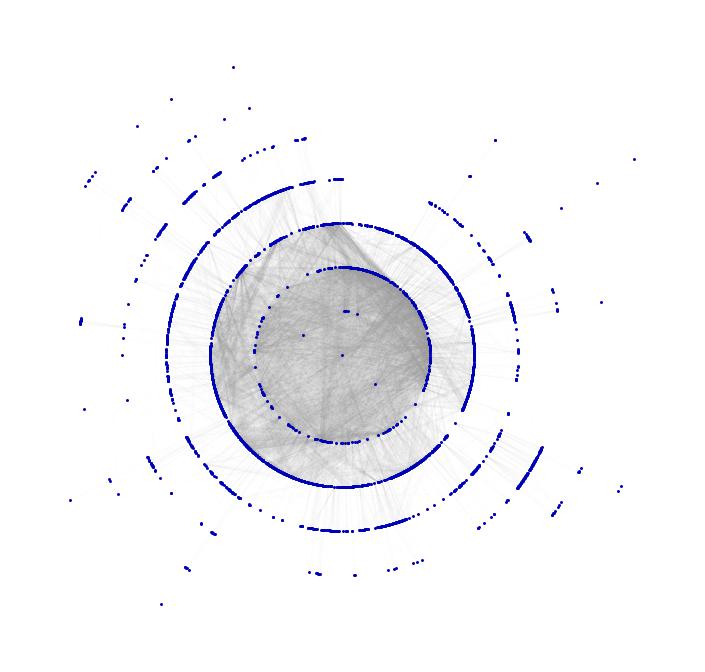
You clearly see the communities in North America, Europe and Asia. This one is also pretty:
Show[TreePlot[Subgraph[grph, ConnectedComponents[grph][[1]]], Center, PlotStyle -> Directive[Gray, Opacity[0.02]]],
 TreePlot[Subgraph[grph, ConnectedComponents[grph][[1]]], Center, EdgeRenderingFunction -> None]]
We have several enhancements of this. First we can easily look at different countries individually. What if an ebola patient arrives at some airport in the US? See simulation here. (Careful 50 MBs!)
There is also something we can do if we want to go the the level of cities. The main problem is that the Wolfram database does not yet have data for all streets between cities. In one of the online conferences it was said that that will be introduced in some later version, which I cannot wait to play with. Until then we have to cheat. (or use some online database; I prefer cheating.)
We developed a model of the spreading of a disease in Nigeria. So we could go about this like this:
Clear["Global`*"]
CountryData["Nigeria", "Population"]
Graphics[CountryData["Nigeria", "Polygon"]]
Then get city names, coords and population:
names = CityData[{All, "Nigeria"}];
citypop = Table[CityData[names[[i]], "Population"], {i, 1, Length[names]}];
citycoords = Table[CityData[names[[i]], "Coordinates"], {i, 1, Length[names]}];
Here comes the cheat. Because we don't have the streets we use Delaunay triangulation:
Needs["ComputationalGeometry`"]
dtri = DelaunayTriangulation[citycoords]; list = {}; Table[
 Do[AppendTo[list, {i, dtri[[All, 2]][[i, j]]}], {j, 1,
   Length[dtri[[All, 2]][[i, All]]]}], {i, 1, Length[dtri]}];
coupling = Table[0, {i, 1, Length[names]}, {j, 1, Length[names]}];
For[i = 1, i < Length[list] + 1, i++,
 coupling[[list[[i]][[1]], list[[i]][[2]]]] = 1;]

coulinginterm = coupling;

coupling = SparseArray[coulinginterm];
which gives the following network
Graphics[Join[
  Table[Circle[citycoords[[i]], 0.02], {i, 1, Length[names]}],
  DeleteCases[
   Flatten[Table[
     If[coupling[[i, j]] == 1,
      Line[{citycoords[[i]], citycoords[[j]]}]] , {i, 1,
      Length[names]}, {j, 1, i}], 1], Null]]]
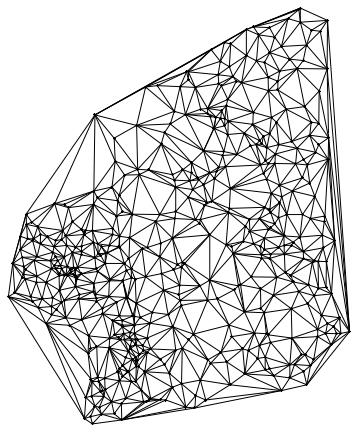
The point in the middle corresponds to the airport where it all starts; then come its neighbours and then their neighbours etc. You could now animate this and change the colours to see how the disease spreads through the different layers. It would be nice if someone could implement that.
There are obviously some problems, i.e. "streets" leaving the country etc, but the general idea should work. The rest is quite the same as before:
(*Paramters*)

[Rho] = 0.2; [Lambda] = 0.1; Mcities = Length[names]; [Mu] = 0.05;

(*Initiation*)

For[i = 1, i <= Mcities, i++, sus[1, i] = 1.; inf[1, i] = 0.0;
 rec[1, i] = 0.;]

(*Starting Outbrake at the following city*)

sus[1, 1] = 0.95; inf[1, 1] = 0.05;
rec[1, 1] = 0.0;

meanNN = coupling.citypop;

sumind = Table[
   Take[Flatten[ArrayRules[coupling[[k, All]]][[All, 1]]],
    Length[ArrayRules[coupling[[k, All]]]] - 1], {k, 1, Mcities}];

sus[i_, j_] :=
 sus[i, j] = (1 - [Mu]) (sus[i - 1,
       j] - [Rho] sus[i - 1, j] inf[i - 1, j]) + [Mu]  Total[
      Table[sus[i - 1, sumind[[j, u]]]*citypop[[sumind[[j, u]]]], {u,
        1, Length[sumind[[j]]]} ] ]/meanNN[[j]];
inf[i_, j_] :=
 inf[i, j] = (1 - [Mu]) (inf[i - 1,
       j] + [Rho] sus[i - 1, j] inf[i - 1, j] - [Lambda] inf[i - 1,
        j]) + [Mu] Total[
      Table[inf[i - 1, sumind[[j, u]]]*citypop[[sumind[[j, u]]]], {u,
        1, Length[sumind[[j]]]} ] ]/meanNN[[j]];
rec[i_, j_] :=
  rec[i, j] = (1 - [Mu]) (rec[i - 1,
        j] + [Lambda] inf[i - 1, j]) + [Mu] Total[
       Table[rec[i - 1, sumind[[j, u]]]*citypop[[sumind[[j, u]]]], {u,
          1, Length[sumind[[j]]]} ] ]/meanNN[[j]];
This time we try to work in parallel:
LaunchKernels[];
tcourse = ParallelTable[{sus[i, j], inf[i, j], rec[i, j]}, {i, 1, 500}, {j, 1, Mcities}]; // AbsoluteTiming
(There is something strange here. This ran in MMA9 in 6.3 seconds- I still have data from the course I taught last year. MMA10 takes ages. After the installation of MMA10 also MMA9 seems to take longer 43 seconds. Is this a bug report?). Note that this time the population sizes of the cities are taken into account and are relevant. If you run
Manipulate[
 Graphics[{Line[Flatten[CountryData["Nigeria", "Coordinates"], 1]],
   Join[Table[{
      RGBColor[tcourse[[t, i, 2]], tcourse[[t, i, 1]],
       tcourse[[t, i, 3]]], Disk[citycoords[[i]], 0.1]}, {i, 1,
      Length[names]}]]}], {t, 1, 500, 1}]
or
poly = Graphics[Polygon[Flatten[CountryData["Nigeria", "Coordinates"], 1]], ImagePadding -> None];
Animate[ImageSubtract[
  Graphics[ListDensityPlot[
    Join[{{4, 3.25, 0}, {4, 14, 0}, {14, 3.25, 0}, {14, 14, 0}},
     Table[{citycoords[[k]][[1]], citycoords[[k]][[2]],
       1. - tcourse[[t, k, 1]]}, {k, 1, Mcities}]],
    InterpolationOrder -> 3, ColorFunction -> "Rainbow",
    PlotRange -> All, Frame -> False, PlotRangePadding -> None]],
  poly], {t, 1, 500, 1}, DefaultDuration -> 20.]
or better
infmax = Max[tcourse[[All, All, 2]]];
frames = Table[
   ImageSubtract[
    Graphics[
     ListDensityPlot[
      Join[{{4, 3.25, 0}, {4, 14, 0}, {14, 3.25, 0}, {14, 14, 0}},
       Table[{citycoords[[k]][[1]], citycoords[[k]][[2]],
         tcourse[[t, k, 2]]/infmax}, {k, 1, Mcities}]],
      InterpolationOrder -> 3, ColorFunction -> "Rainbow",
      PlotRange -> All, Frame -> False, PlotRangePadding -> None,
      ColorFunctionScaling -> False]], poly], {t, 1, 500, 6}];
you get nice animations like this one:
I have noticed that Nigeria needs to be rotated, but I hope that the idea becomes clear. I am also aware that there are many flaws in this. SIR is certainly not the best way forward to model Ebola. Any population dynamicist and/or health expert can certainly come up with an endless list of problems. The network is not perfect. For more serious applications we actually use models for the cities, i.e. street connections among close cities and airport connections among countries etc. The problem is that if we simulate between 200-20000 cities per country plus the airports, a standard laptop runs into trouble. On the bright side, we have a cluster on which this kind of larger simulations work just fine.
Hope that you like this anyway,
Marco
 Attachments:


