Message Boards Message Boards

0
|
3983 Views
|
3 Replies
|
0 Total Likes
View groups...
Share
Share this post:
GROUPS:

Report Generation: Doubled Output

I watched a video by John Fultz called Report Generation with Wolfram Technologies and wanted to try it out. I created a template notebook and a notebook that generates a report based on the template. For some reason, I am getting my output twice as shown below: enter image description here

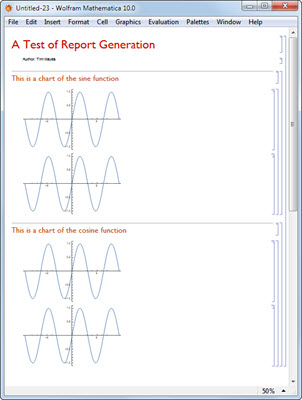
I have no idea what is causing this. I have attached the notebooks for anybody to look at, and any help would be appreciated.

Also, when I click the Help button in the template notebook editor, I get this message:

"paclet:guide/ReportGeneration" could not be found.

Is there some way that I can get that paclet?

Attachments:
POSTED BY: Tim Mayes
3 Replies
POSTED BY: Tim Mayes

Paul,

Thanks for the feedback, and you are right that I had the same function twice. That was because I quickly put that together as an example.

I changed that function and still have exactly the same problem. Also, I had the same doubled output in my original template that was actually a beginning for what I want to do. Just to be clear, there are two charts that should be in the report, but each one is appearing twice.

Any other ideas?

Tim

POSTED BY: Tim Mayes
Posted 10 years ago

Hi Tim

I think it is because in your template generator you have a duplicate function, for both sin and cos you are using PLot[Sin[x]]

Paul.

POSTED BY: Paul Cleary
Reply to this discussion
Community posts can be styled and formatted using the Markdown syntax.
Reply Preview
Attachments
Remove
or Discard

Group Abstract Group Abstract