In two previous posts I looked at crime statistics for the cities of St. Louis and Chicago, and how to visualize them geographically. In this post I will focus on using SemanticImport and Dataset to look at aspects of crime in the City of San Francisco. Like Chicago, San Francisco has a modern clearing house for its data, making the import of data into the Wolfram Language very straightforward:
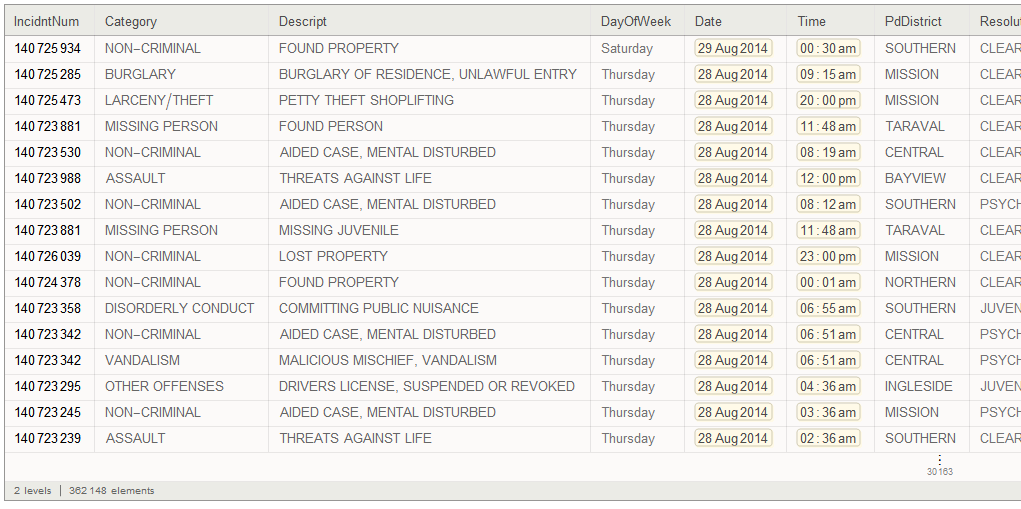
dataset = SemanticImport["crimes.csv"]
All data entries are automatically recognized by type (string, number, date, geoposition) and presented in a typical database view with named columns:
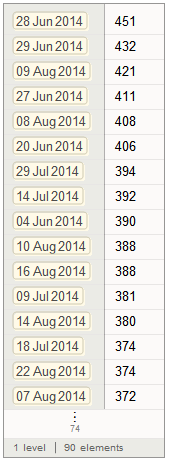
In this case the data goes back only 90 days with about 30,000 records. We can now use this dataset to obtain basic descriptive statistics. For example we can look at the days with the most recorded crimes. Here, we group the data by date and look at the Length of each group to indicate the number of crimes. We then sort in reverse: days with the most crimes come first:
dataset[GroupBy[Key["Date"]] /* Sort /* Reverse, Length]
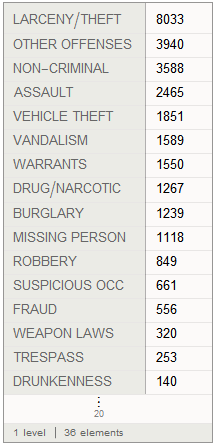
Now let's take a look at the more common crimes that the City of San Francisco records. The command syntax is identical as above with only the Key to group on being different. By far the largest category is theft, followed by a miscellaneous (other offenses) categoy
dataset[GroupBy[Key["Category"]] /* Sort /* Reverse, Length]
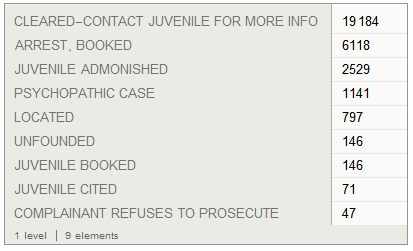
Another interesting category to examine is Resolution, which indicates what the police did with the suspect. Note how most cases the suspect was cleared, followed by arrests/bookings, and in third place a warning (to a juvenile):
dataset[GroupBy[Key["Resolution"]] /* Sort /* Reverse, Length]
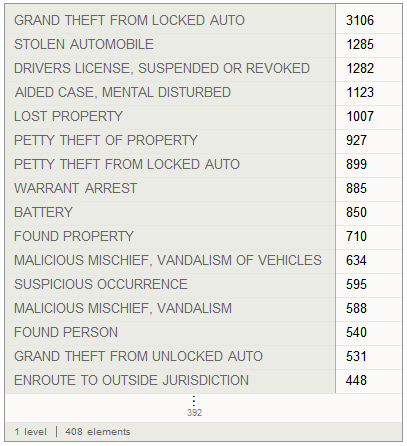
Now let's take a look at the most common types of crime in San Francisco. Here we can see that items being stolen from a locked car is the most commonly recorded crime. In second place comes the actual theft of the automobile, and in third place comes 'drivers license suspended/revoked' (presumably while the suspect is operating a vehicle).
dataset[GroupBy[Key["Descript"]] /* Sort /* Reverse, Length]
To help visualize all these cases, you can map any aspect of this crime data with this mapping function:
map[ds_Dataset,criterion_] := Module[{filter},
   filter=ds[Select[criterion]];
   GeoGraphics[Point[Normal[filter[All,"Location"]]],
      GeoCenter->Entity["City", {"SanFrancisco", "California", "UnitedStates"}],
      GeoRange->Quantity[15,"km"]]
]
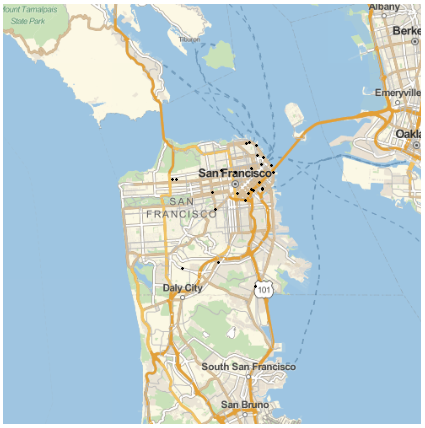
Now we can look at the geographical distribution of all arrests:
map[dataset, #Resolution == "ARREST, BOOKED" &]
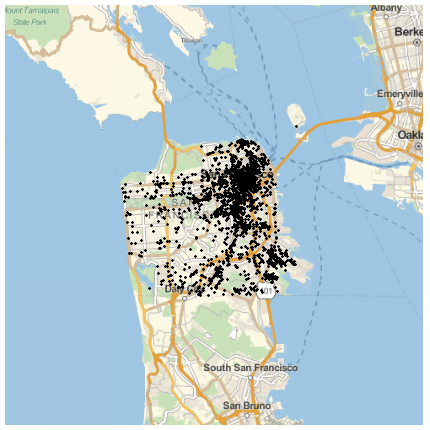
Or theft from cars on a given date (which seems to be more common in downtown San Francisco):
map[dataset,And[Slot["Descript"]=="GRAND THEFT FROM LOCKED AUTO",Slot["Date"]==DateObject[{2014,8,15}]]&]