I have attached a notebook to this response that goes through the steps of building a regression model with LinearModelFit and using it for classification. One important question is how to separate the regression model values so we can obtain the best possible classification rates. In the notebook this is done using ROC. (See http://en.wikipedia.org/wiki/Receiver_operating_characteristic .)
LinearModelFit has several signatures. For the data we have I think the most convenient one is LinearModelFit[{m,v}] .
In order to keep the exposition simple in the notebook the regression is done with the two numerical columns "education-num" and "hours-per-week". With the replacement rules {"<=50K"->0,">50K"->1} we convert the data column "income" into a vector of 0's and 1's.
In the attached notebook we call positive the income values ">50K" and negative the income values "<=50K".
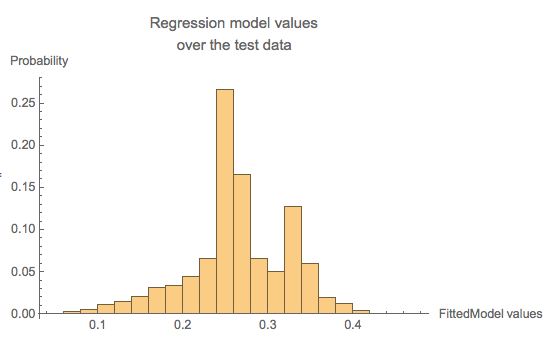
The result of LinearModelFit is a function based on the training set of data. We can plot a histogram of values from the regression model, and then we pick a threshold above which the model values are considered to be 1's (and hence ">=50K").
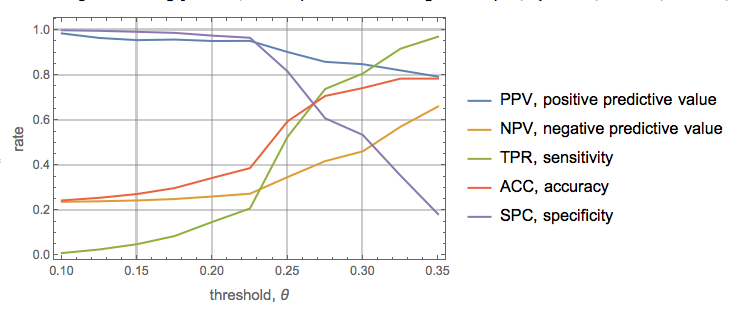
In the attached notebook the first example of using the result of LinearModelFit is extended with a more systematic approach of determining the best threshold to separate the regression model values. The ROC functions Positive Predictive Value (PPV), Negative Predictive Value (NPV), True Positive Value (TPV), accuracy (ACC), and specificity (SPC).
 Attachments:


