I have desperately tried for hours to understand what I did wrong with this short and pretty basic code:
c=1 Plot3D[{(c^2*Pi)/(x^2*Pi)}, {x, 1, 3}, {y, 0, c}, RegionFunction -> Function[{x, y, z}, 0 <= y <= x - c]]
The graph I get is this one: 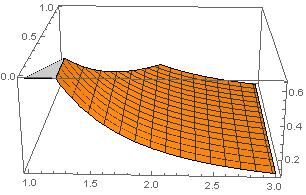
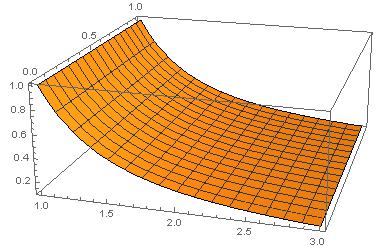
Looking at the z axis, it becomes quite obvious that this doesn't make any sense. If c=1, then the value of z should be z=1 for x=1. The strange thing is that the Plot works totally fine if I a) delete the Region restriction or b) remove the power of 2 from x, then it's just a nicely behaving plane:
I have no idea what's going on. Does anybody know how I can implement the restriction I want without messing up the graph? And what's the reason for this strange behaviour?
Thanks in advance!


