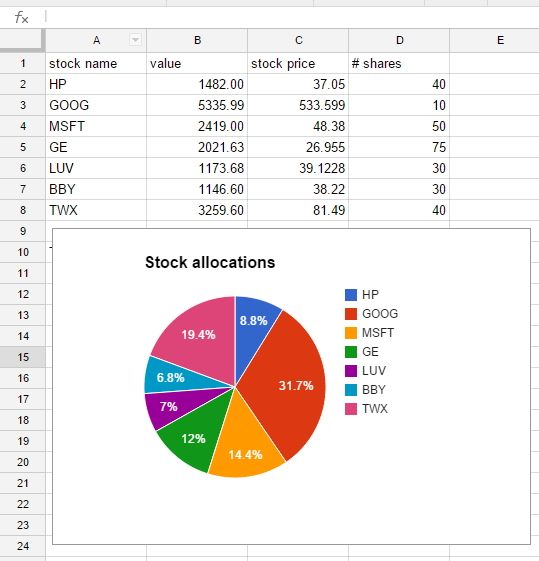
Let's assume that we have a spreadsheet that has the various stocks and number of shares of each stock that we own. I want to make a pie chart that shows how my wealth is distributed amongst my stocks. To do this, I will make use of an embedded api functions that calls the WolframCloud to get current stock prices.
First, we'll deploy an APIFunction that returns the price of the stocks.
co = CloudDeploy[APIFunction["comp" -> "Company", FinancialData[#comp] &], Permissions -> "Public"]
Let's make sure that this works in Mathematica using URLExecute with a selected company name:
In[23]:= URLExecute[co, {"comp" -> "aapl"}]

Out[23]= 116.64
That looks correct. Next, call EmbedCode with option "Googledocs" to get a function that can be called within our spreadsheet
EmbedCode[co, "GoogleDocs"]
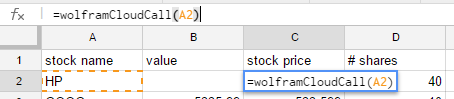
Copy the returned code to the "script editor" of your google spreadsheet. The default name of the function is wolframCloudCall, which I don't change. Now, to get a result, I need to type =wolframCloudCall(-cell with company name-) into a cell, and the result will be returned to that cell.
I have created a Google Spreadsheet that has several stocks that I'm pretending to own. The spreadsheet with pie chart (created using columns A and B) now look like this, where column C contains the function calls to WolframCloud.