Dear Intan,
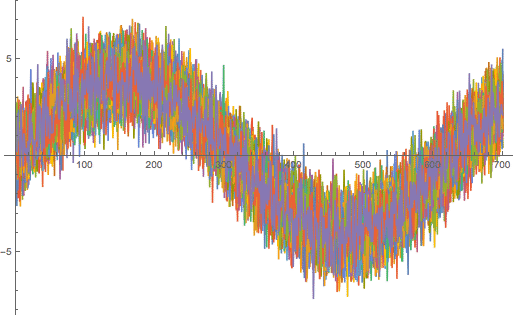
I guess that it depends a bit in which form your data is, and whether you want to code it "by foot" or use built in functionality. Here is one example. I first generate the data:
data = Transpose[Table[4.*Sin[0.01*n] + RandomVariate[NormalDistribution[0, 1]], {n,1, 700}, {m, 1, 50}]];
representing 50 time series with 700 points each.

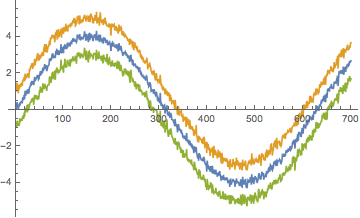
You can draw the ensemble average +/- the standard deviation like so
ListLinePlot[{Mean[data], Mean[data] - StandardDeviation[data], Mean[data] + StandardDeviation[data]}]
or equivalently like so
ListLinePlot[{Mean@ data, Mean@data + StandardDeviation@ data, Mean@ data - StandardDeviation@ data}]
Both give

You can also use the built in ErrorListPlot function:
Needs["ErrorBarPlots`"];
ErrorListPlot[Transpose[{Mean[data], StandardDeviation[data]}], PlotRange -> All]
There are other methods, and if your data comes in the format of a Mathematica time series, or you want to use DateList, you would again have lightly different commands. Also, for rainfall data, because of its distribution, you might want not to just plot the standard deviation around it.
Hope this helps,
Marco