Hi Andre,
it is not OK!
The solution in my response was just given in terms of your question. But a general remark
must be made (as I found during a sleepless night):
A Voronoi diagram basically deals with distances. Angular coordinates are therefore not
appropriate here. If one wants to do it right, one has to perform a transformation into grid
coordinates first. I tried, and my little code now looks like this:
ClearAll["Global`*"]
(* just 50 french cities are taken into account: *)
coord = Take[
Table[CityData[c, "Coordinates"], {c, CityData[{All, "France"}]}],
50];
(* transformation from angular coordinates to grid-coordinates: *)
coordxy =
GeoGridPosition[
GeoPosition[#, "WGS84"], {"UTMZone31",
"CentralScaleFactor" -> 0.9996, "GridOrigin" -> {500000, 0}}][[
1]] & /@ coord;
(* now the voronoi tessellation is made: *)
border = ConvexHullMesh[coordxy];
voron = VoronoiMesh[coordxy];
chm = ConvexHullMesh @@@ MeshPrimitives[voron, 2];
ri = RegionIntersection[border, #] & /@ chm;
grLines = MeshPrimitives[#, 1] & /@ ri;
(* procedure for transformation graphics lines to GeoPath: *)
makeGeoPath[lineList_] := Module[{pts, geoPts},
pts = lineList[[;; , 1, 1]];
geoPts =
GeoPosition[GeoGridPosition[#, "UTMZone31"]] & /@
Append[pts, pts[[1]]];
GeoPath[geoPts]
]
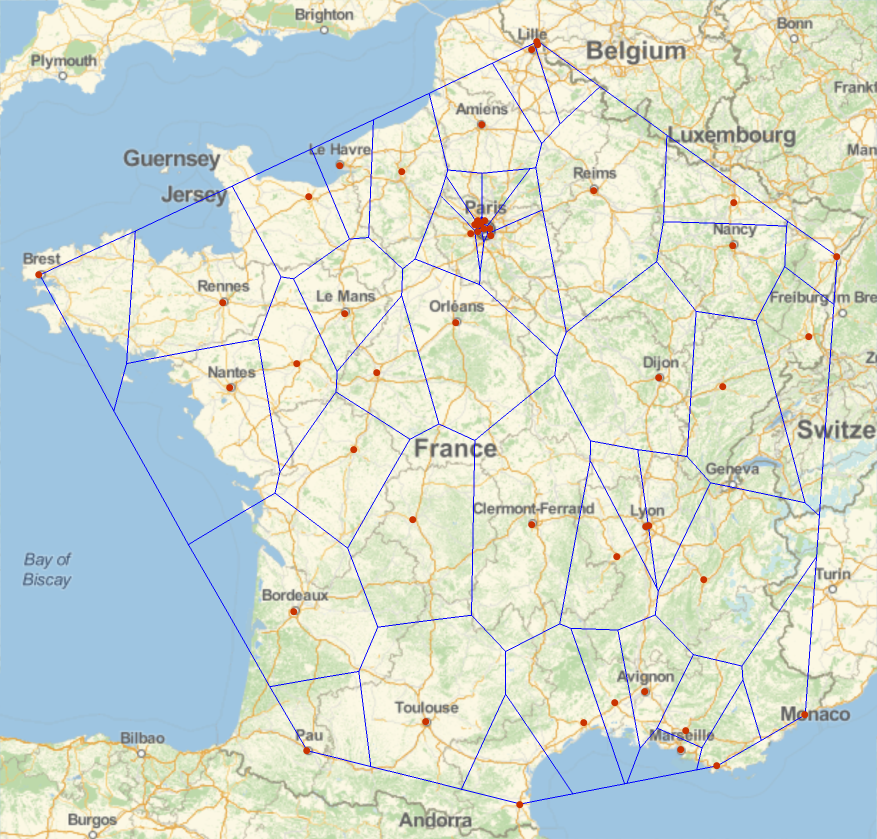
(* show the result: *)
GeoGraphics[{Blue, makeGeoPath /@ grLines, Red,
GeoMarker[GeoPosition /@ coord, \[FilledCircle]]},
ImageSize -> Full]
The output then is:

With using simply the angular coordinates, the result is just wrong:
Cheers Henrik


