Hi Zachary,
I was checking your notebook that you have uploaded here and I have found some discrepancies in your notebook.
Are You trying to plot some wave functions for some conditions? (Like for n=2, l=1, m=0) Because I noticed that,
Your wave function is different in two places. In one case, there is a Sinh[\[Theta]] in another case, there is Sin[\[Theta]].
Also I don't think you can plot a wave function with imaginary quantities involved in it. Because I tried to plot the following,
Plot[Exp[I x],{x,0,10}]
and it gives me this,
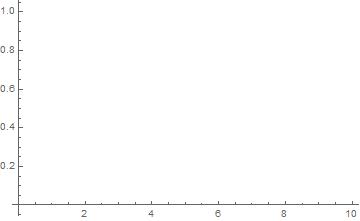
Means nothing.
So perhaps you should take care of the real part and imaginary part separately.
Also my idea is, a wave function can be imaginary but to plot the wave function, you can take only the real part in consideration because the the system you are dealing with is real, not imaginary. In that case, the plot can be done.
And one more thing, I think I understand why did not you get any plot.
Your wave function is
1/(8 Sqrt[Pi]) (z r/a0)^(3/2) (z r/a0) Exp[-z r /(2 a0)] Sin[\[Theta]] Cos[\[Phi]]
where a0 = 5.29177*10^-11 and z, r are suitable parameters.Now as a0 is in denominator and it has a very small value, it shows me
"Infinite expression 1/0 encountered."
because in that case,Exp[z r/(2 a0)] goes to infinity, i.e. the wave function diverges and a wave function can not diverge.
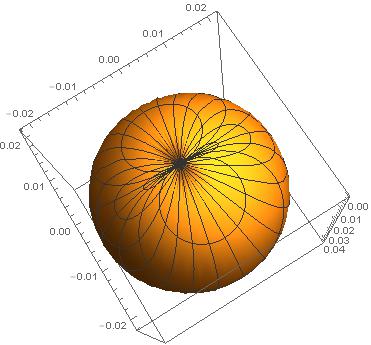
I checked it with relatively large value if a0, (say 1) and I have got a plot.
Manipulate[SphericalPlot3D[1/(8 Sqrt[Pi]) (z r/a0)^(3/2) (z r/a0) Exp[-z r /(2 a0)] Sin[\[Theta]] Cos[\[Phi]], {\[Theta], 0,Pi}, {\[Phi], 0, 2 Pi}], {z, 1, 4, 1}, {r, 0.001, 1}]
This is the plot I have got for z=1, r=1.
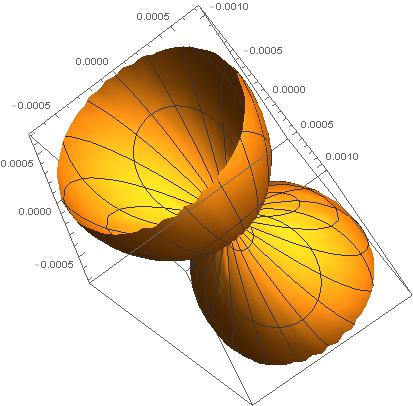
Also, If you are trying to plot the probability density function in 3D,
Manipulate[SphericalPlot3D[(1/(8 Sqrt[Pi]) (z r/a0)^(3/2) (z r/a0) Exp[-z r /(2 a0)] Sin[\[Theta]] Cos[\[Phi]])^2, {\[Theta], 0,Pi}, {\[Phi], 0, 2 Pi}], {z, 1, 4, 1}, {r, 0.001, 1}]
This is the plot I have got for z=1, r=1.
Sincerely, Suvadip
 Attachments:


