Message Boards Message Boards

6
|
15536 Views
|
5 Replies
|
19 Total Likes
View groups...
Share
Share this post:

Using Map projections with Astronomical data

Posted 10 years ago
POSTED BY: Marcelo De Cicco
5 Replies

Thanks Jeff.

POSTED BY: Marcelo De Cicco
POSTED BY: Jeffrey Bryant
Posted 10 years ago

Just a note:

triplets[[;;, 3]] = Rescale @ triplets[[;;, 3]]

will be faster.

POSTED BY: Kuba Podkalicki

Fine! And what about colorizing the points? In geographic functions is allowed to do this?

See these other results from Kuba:

Kuba `s way

POSTED BY: Marcelo De Cicco

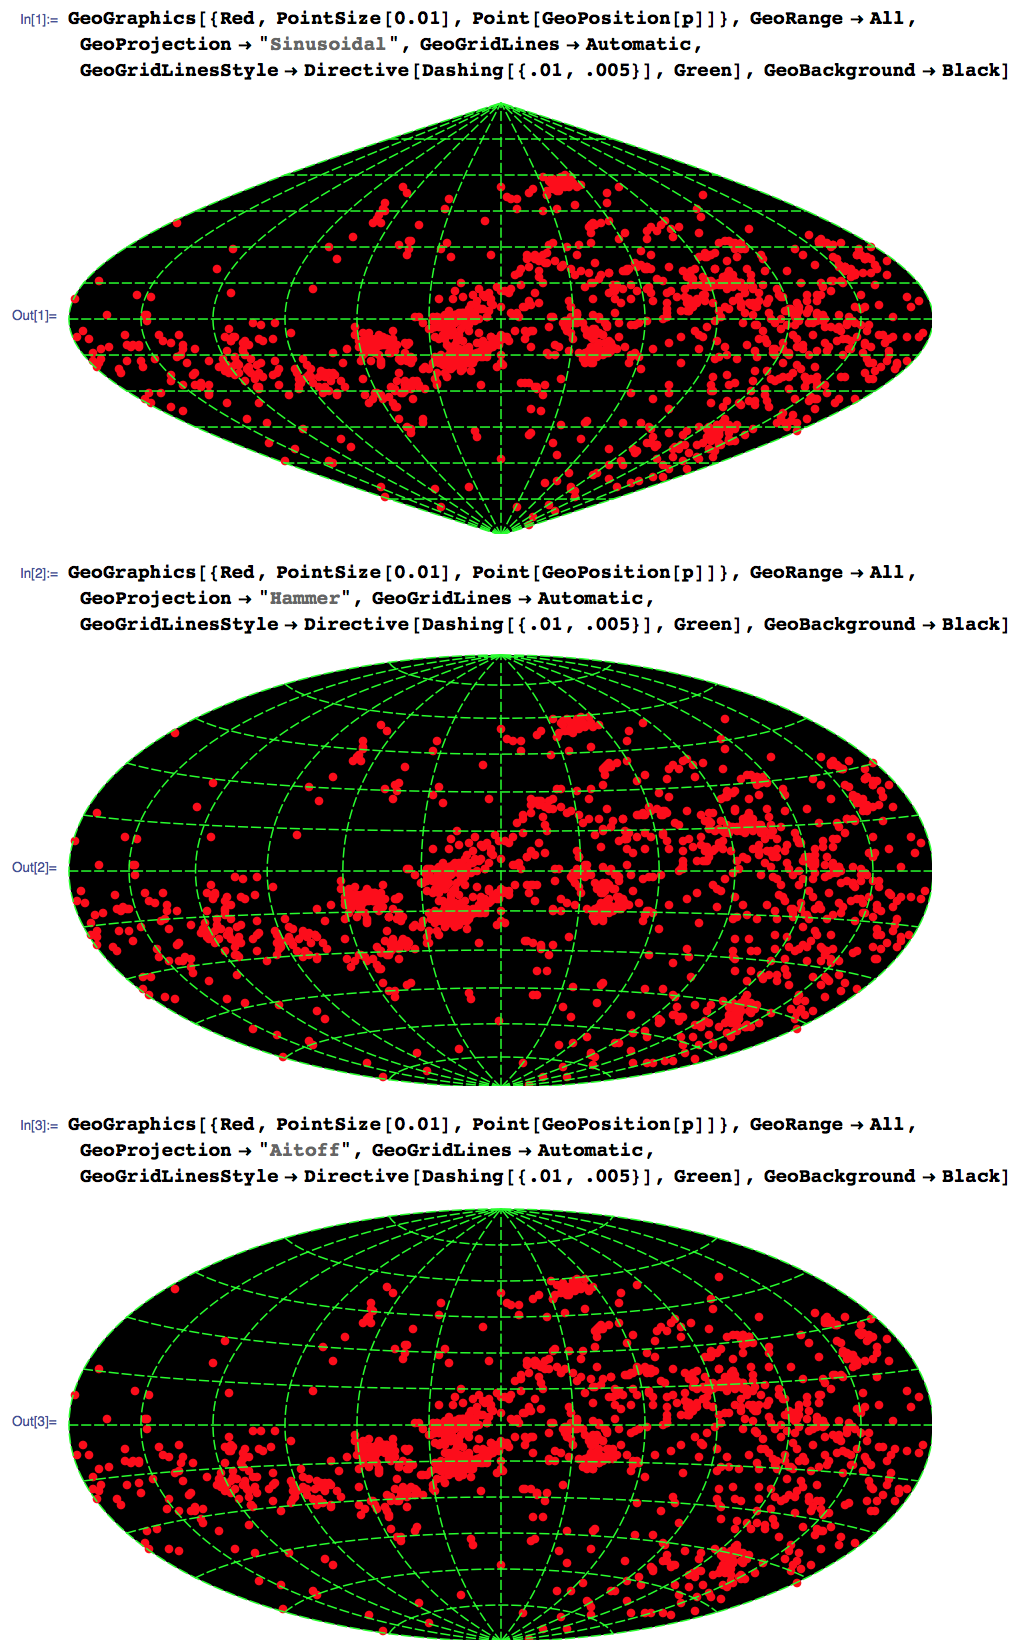
Starting from your proposed solution I would suggest the following simplification. A single GeoGraphics can produce the desired output and handles everything related to the projection. In version 10.0.2 GeoProjectionData also has the "Hammer" (or Hammer-Aitoff) and "Aitoff" projections.

rad = Import["~/Downloads/DadosRad2014_RADECVELOC_15124_1024.dat"];
p = Cases[rad, {a_, b_, c_} -> {b, Mod[a, 360, -180]}];

GeoGraphics[{Red, PointSize[0.01], Point[GeoPosition[p]]}, 
 GeoRange -> All, GeoProjection -> "Sinusoidal", 
 GeoGridLines -> Automatic, GeoGridLinesStyle -> Directive[Dashing[{.01, .005}], Green], 
 GeoBackground -> Black
]

enter image description here

Reply to this discussion
Community posts can be styled and formatted using the Markdown syntax.
Reply Preview
Attachments
Remove
or Discard

Group Abstract Group Abstract