Message Boards Message Boards

How to utilize the material properties inside Mathematica?

Posted 10 years ago
POSTED BY: Thai Kee Gan
9 Replies
Posted 9 years ago
POSTED BY: Thai Kee Gan

I don't know. What about changing the pressure to prevent the water from evaporating?

Say

ThermodynamicData["Water", "ThermalConductivity", {"Temperature" -> Quantity[375, "Kelvins"], "Pressure" -> Quantity[1114, "Hectopascals"]}]

(*Quantity[0.679663, ("Watts")/("KelvinsDifference" "Meters")]*)

vs the same at standard pressure:

ThermodynamicData["Water", "ThermalConductivity", {"Temperature" -> Quantity[375, "Kelvins"]}]

(*Quantity[0.0252191, ("Watts")/("KelvinsDifference" "Meters")]*)

Cheers,

M.

POSTED BY: Marco Thiel
Posted 10 years ago

Thank you

POSTED BY: Thai Kee Gan
Posted 10 years ago

Is there any way for me to store the data into my PC? As I need to iterate the information according to the temperature of the material.

POSTED BY: Thai Kee Gan

Well, you can use the Export command.

Export["~/Desktop/conductivitydata.csv", data]

would be one option (you obviously might need to adapt the directory).

Cheers,

M.

POSTED BY: Marco Thiel
Posted 10 years ago

So, the data is extracted from WolframAlpha, which is connected to the server and it does not stored in my PC?

POSTED BY: Thai Kee Gan
Posted 10 years ago

Oh thanks alot Marco. Your are right, that graph looks weird. Thanks for verifying it for me. I need to write the program to change the value of the properties of the materials according to the temperature given. Now that I know what to do, you really helped me :D

POSTED BY: Thai Kee Gan

Just to confirm one point. On this website:

http://www.efunda.com/materials/elements/TCTable.cfm?ElementID=Al

there is some data on Aluminium. I can use that data (Import does not work so this requires manual work):

dataurl = Partition[ToExpression@StringSplit[
     {"1 101325 4110 2 101325 8180 3 101325 12100 4 101325 15700 5 \
101325 18800 6 101325 21300 7 101325 22900 8 101325 23700 9 101325 \
23900 10 101325 23500 15 101325 17600 20 101325 11700 30 101325 4950 \
40 101325 2400 50 101325 1350 60 101325 850 70 101325 585 80 101325 \
432 90 101325 342 100 101325 302 150 101325 248 200 101325 237 250 \
101325 235 300 101325 237 350 101325 240 400 101325 240 500 101325 \
236 600 101325 231 800 101325 218"}, " "][[1]], 3]

If we plot everything together (red dots Mathematica and blue curve from website) we get:

Show[ListPlot[Transpose[{Range[100, 1000, 100], QuantityMagnitude@ data}], PlotRange -> All, PlotStyle -> Red], 
ListLinePlot[dataurl[[-10 ;;, {1, 3}]]]]

enter image description here

which shows good agreement.

Cheers,

Marco

POSTED BY: Marco Thiel

This is not elegant and a bit slow, but

data=Table[WolframAlpha["Thermal Conductivity of Aluminium at " <> ToString[h] <>  "K", {{"Result", 1}, "ComputableData"}], {h, 100, 1000, 100}]

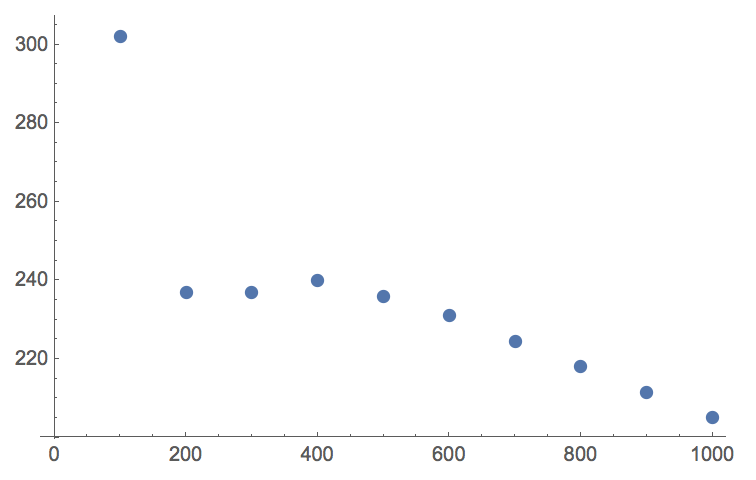
appears to be giving results. Here is a plot

ListPlot[Transpose[{Range[100, 1000, 100], QuantityMagnitude@ data}]] 

This looks a bit strange to me, but there we go:

enter image description here

Cheers,

M.

I cannot verify the values, but some do not seem to be in total disagreement with, data, e.g. here.

POSTED BY: Marco Thiel
Reply to this discussion
Community posts can be styled and formatted using the Markdown syntax.
Reply Preview
Attachments
Remove
or Discard

Group Abstract Group Abstract