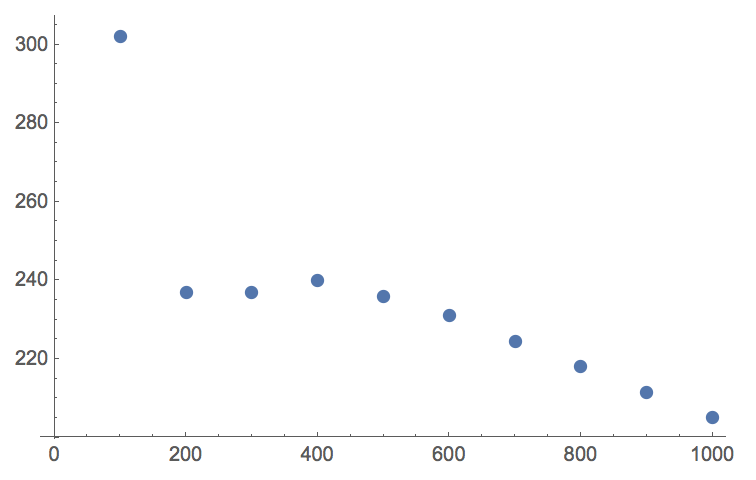
Just to confirm one point. On this website:
http://www.efunda.com/materials/elements/TCTable.cfm?ElementID=Al
there is some data on Aluminium. I can use that data (Import does not work so this requires manual work):
dataurl = Partition[ToExpression@StringSplit[
{"1 101325 4110 2 101325 8180 3 101325 12100 4 101325 15700 5 \
101325 18800 6 101325 21300 7 101325 22900 8 101325 23700 9 101325 \
23900 10 101325 23500 15 101325 17600 20 101325 11700 30 101325 4950 \
40 101325 2400 50 101325 1350 60 101325 850 70 101325 585 80 101325 \
432 90 101325 342 100 101325 302 150 101325 248 200 101325 237 250 \
101325 235 300 101325 237 350 101325 240 400 101325 240 500 101325 \
236 600 101325 231 800 101325 218"}, " "][[1]], 3]
If we plot everything together (red dots Mathematica and blue curve from website) we get:
Show[ListPlot[Transpose[{Range[100, 1000, 100], QuantityMagnitude@ data}], PlotRange -> All, PlotStyle -> Red],
ListLinePlot[dataurl[[-10 ;;, {1, 3}]]]]

which shows good agreement.
Cheers,
Marco