Yesterday, Stephen Wolfram announced the release of this great solution for storing and sharing data coming from sensors, devices, programs, humans or anything else: the Wolfram Data Drop. I think this is a turning point; it completely changes the game on how I've been interacting with streams of data. In this post I want to share with you three ideas that I've been exploring using the Raspberry Pi 2, which, by the way, it runs Mathematica about 10x faster than its predecessors!
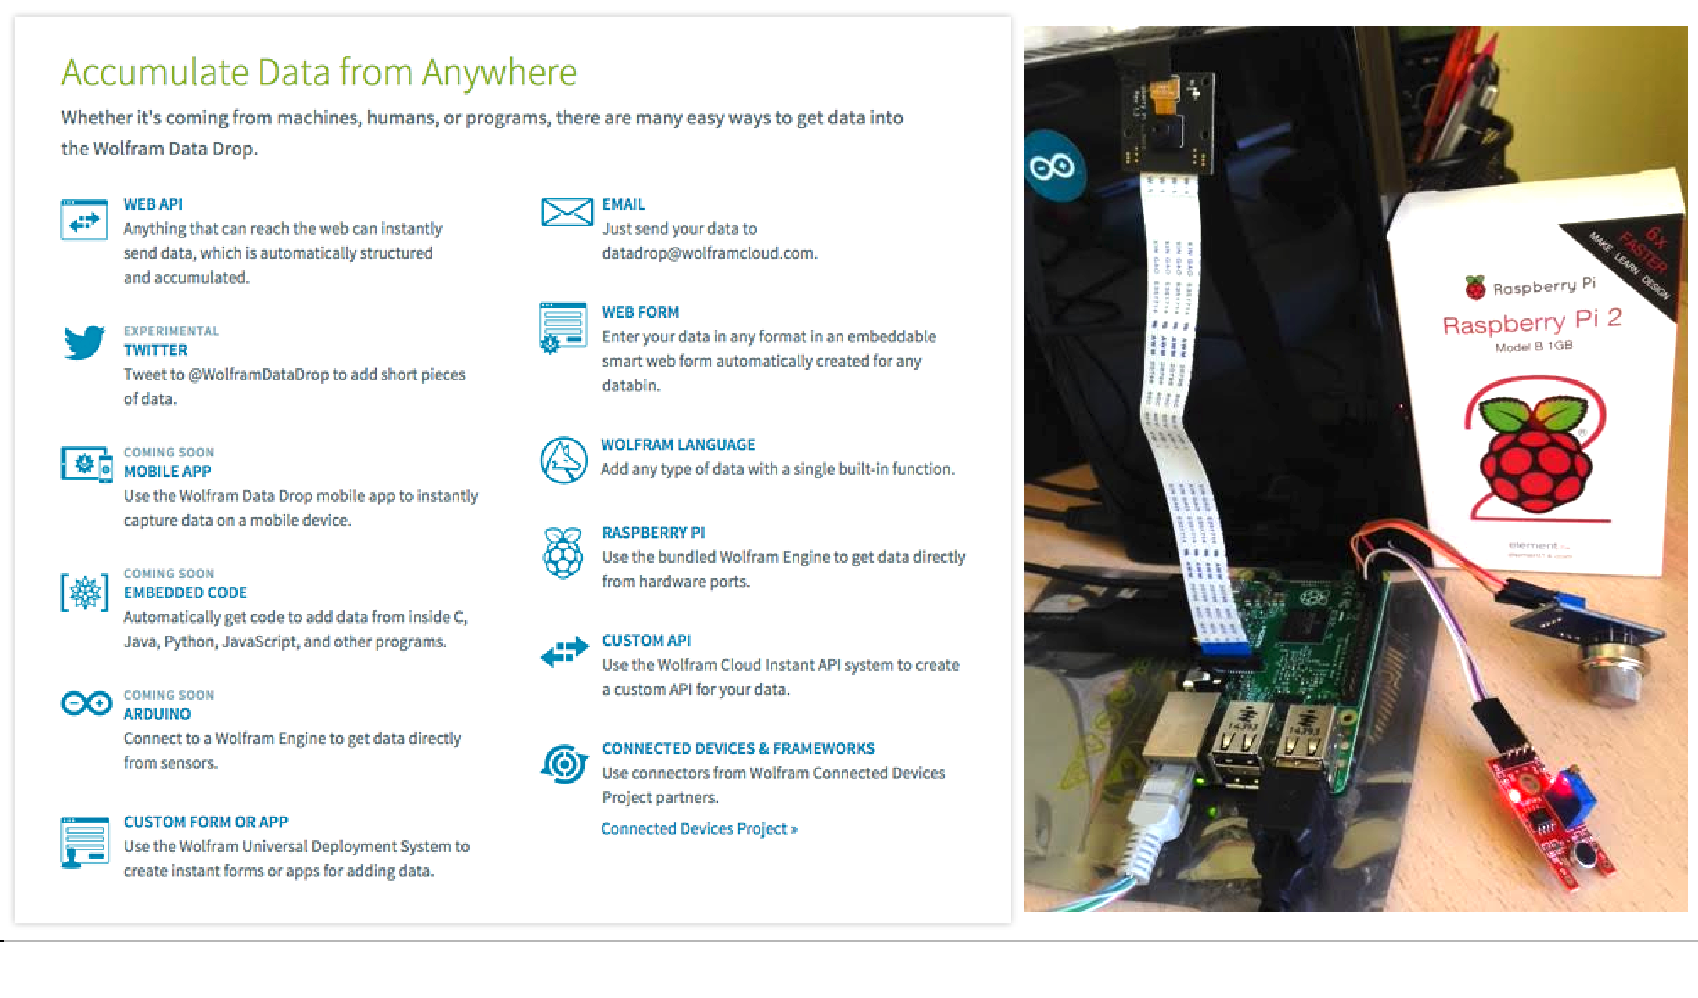


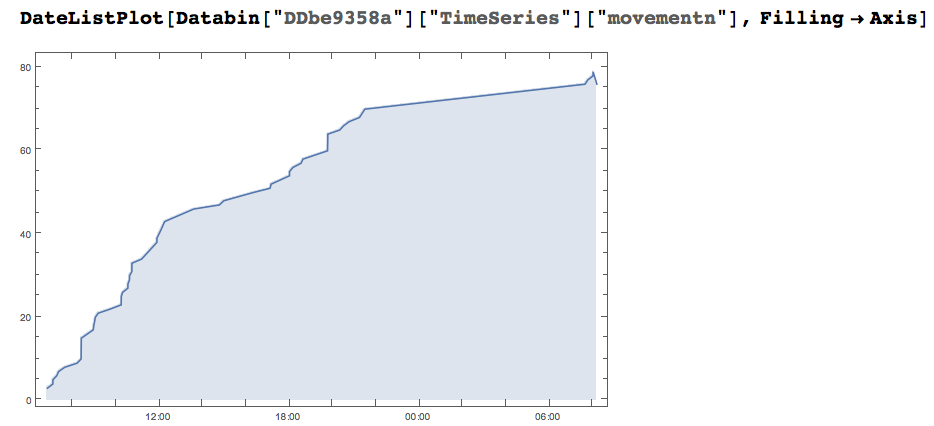
The first idea that came to my mind was to revisit some of the experiments I had carried out in the past, like this home alarm system. In a matter of minutes, I was able to set up an activity tracker for my home's hall. Every time I pass by, the PIR motion sensor adds a 1 to the "mov" variable that is being dropped to this databin every 20 minutes. Check it out in W|A, it's live and growing! == Data drop 3v1UbpOM
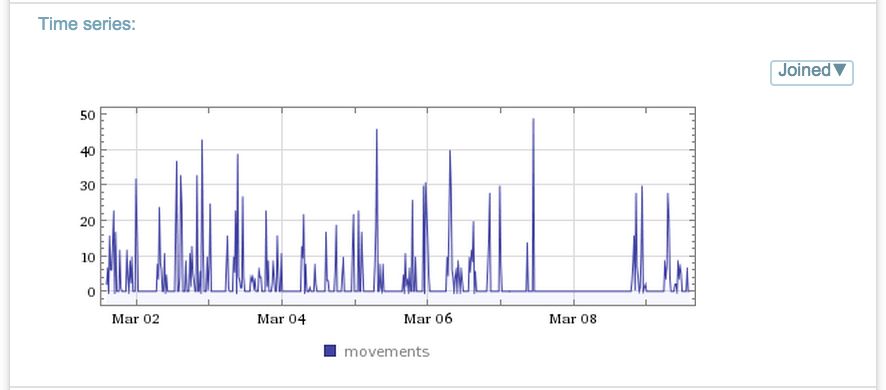
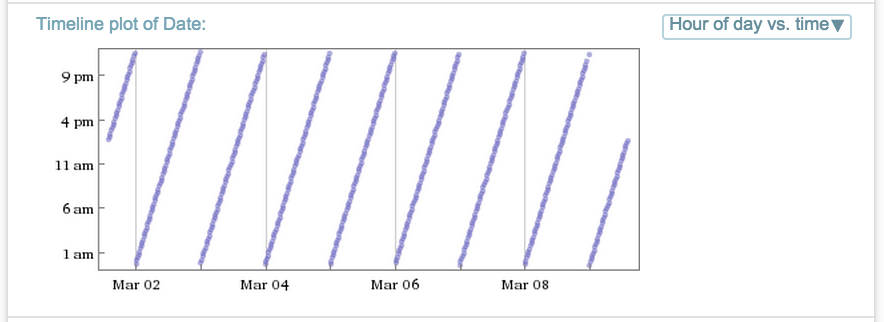
This is such a great thing, that dataset is just about me but it could be monitoring whatever you want, like your cat's crazy habits. For this example the data is being logged periodically but you could set it up in an event-based manner. Like here, whenever a movement is detected, it triggers the RaspiCam and it sends the snapshot to the following databin:
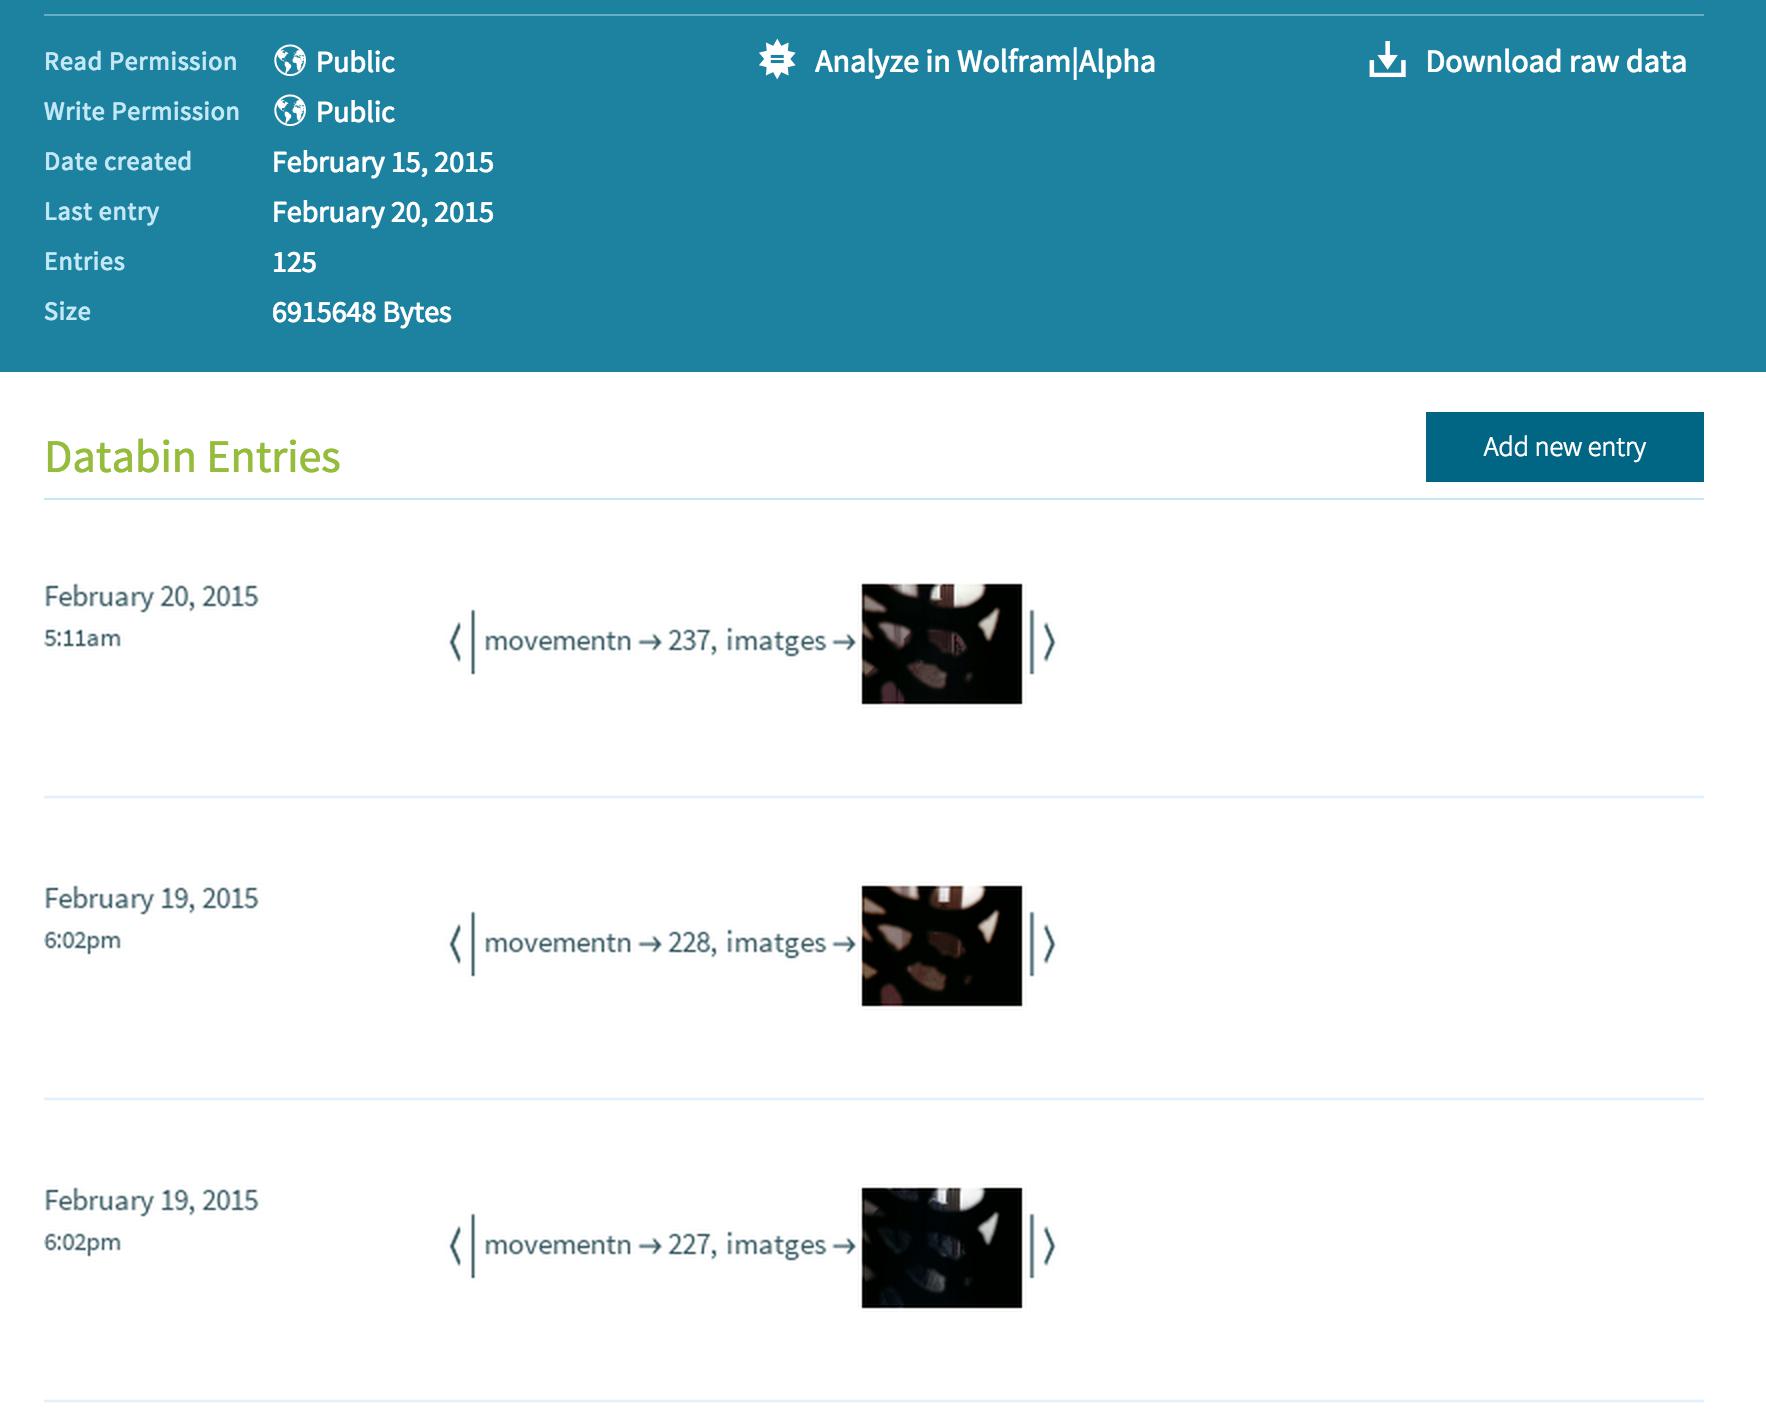
What about making a several days long time-lapse of you?
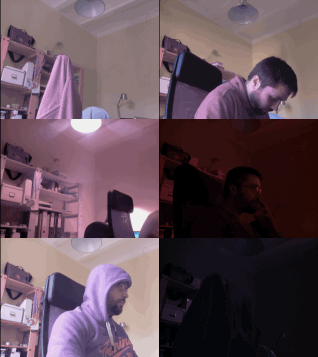
Or what about using other sensors? The possibilities are just endless!
Finally, let me end up with the following collaborative activity for the classroom. Here is how you can carry it out.
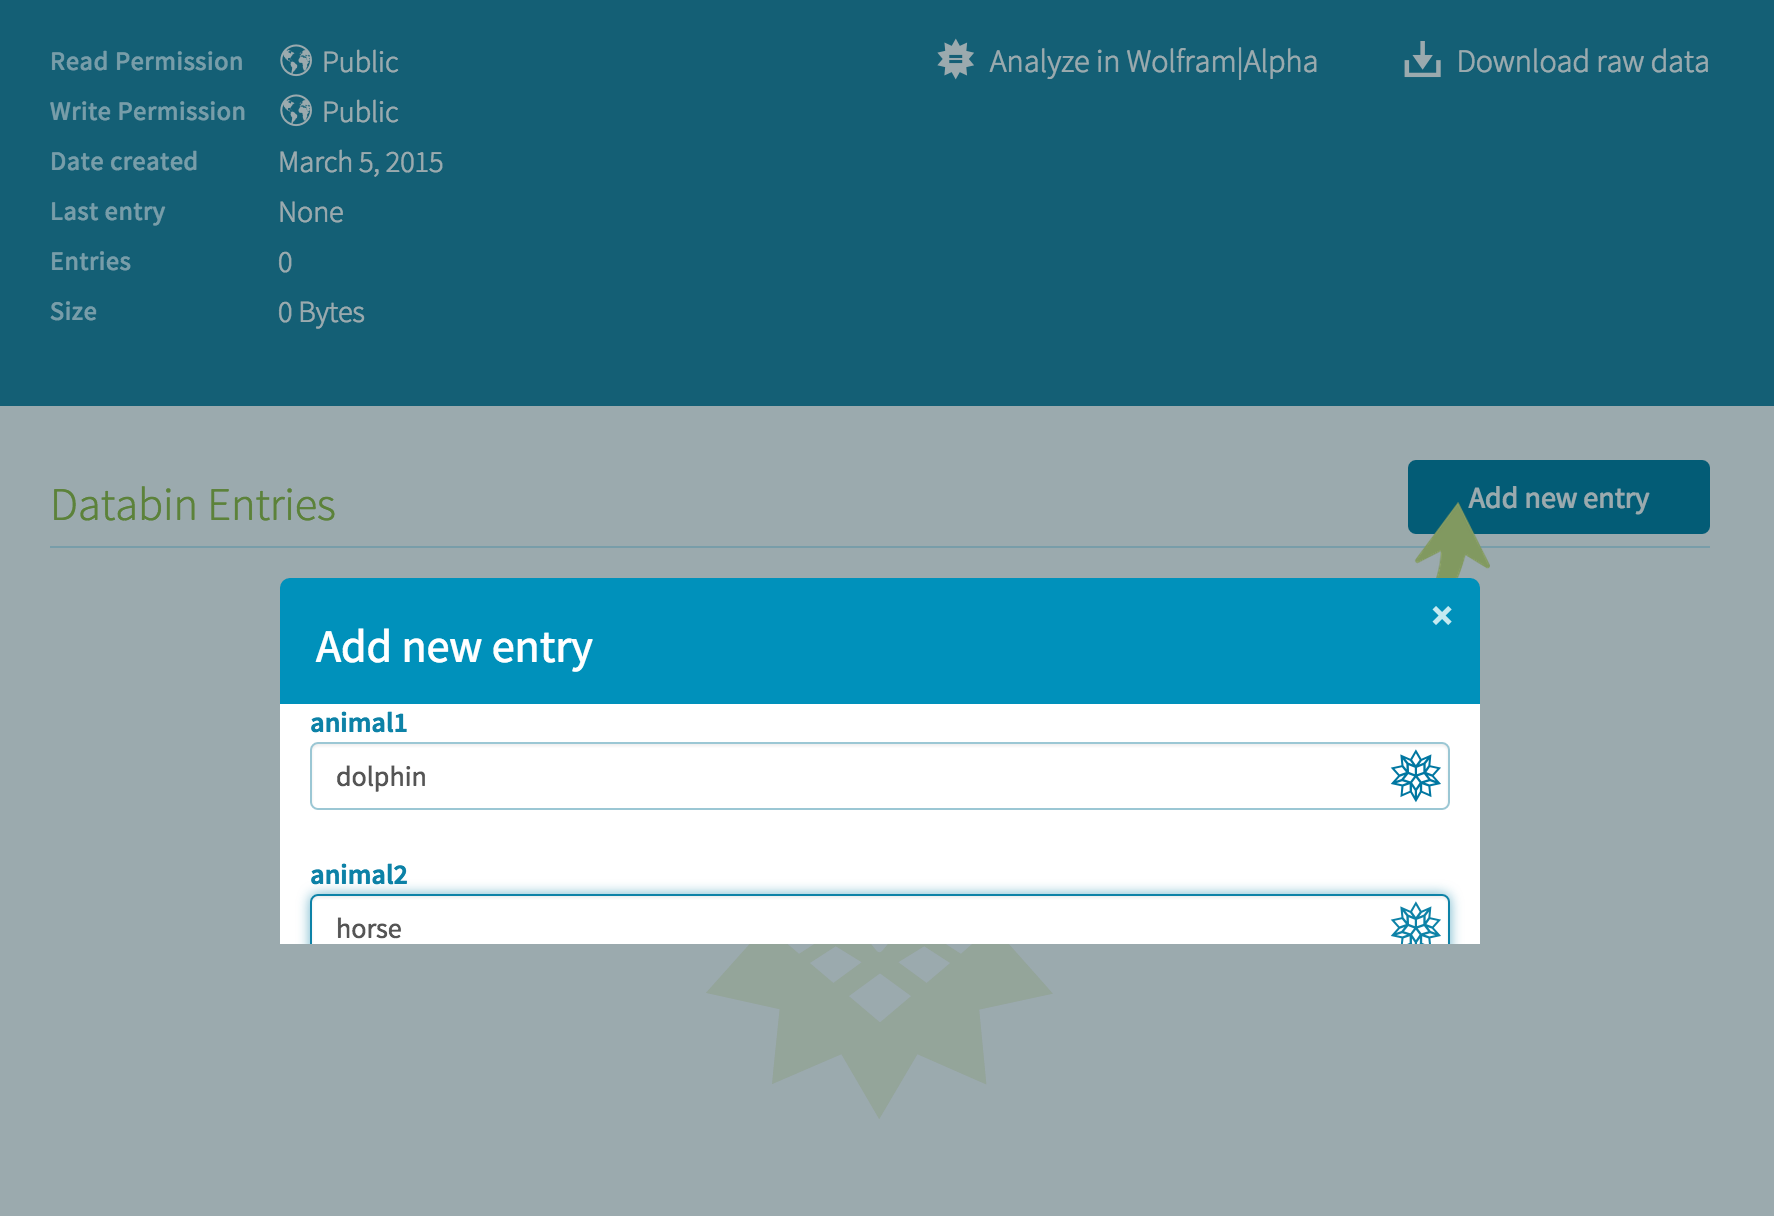
First, you create a public databin to add two different names of animals that the students will enter:
CreateDatabin[ "Interpretation" -> {"animal1" -> "Animal", "animal2" -> "Animal"}, <|"Name" -> "Classroom Zoo"|>]
Then, ask your students to submit their favorite animals' names, using the web-based platform http://wolfr.am/3zCzVgPJ
Their individual entries will ended up generating things similar to this amazing Graph!
data = Values[Databin["3zCzVgPJ"]];
pairs = Apply[Rule, Drop[Transpose[{data["animal1"], data["animal2"]}], 9], {1}]

pics = Map[# -> #["Image"] &, Union[Flatten[Drop[Transpose[{data["animal1"], data["animal2"]}], 9]]]];
style ={ VertexSize->1.2,EdgeStyle->Directive[Arrowheads[{{.02,.6}}],Hue[.4,1,.3]],VertexShape->pics};
Graph[pairs, style, ImageSize -> 900]
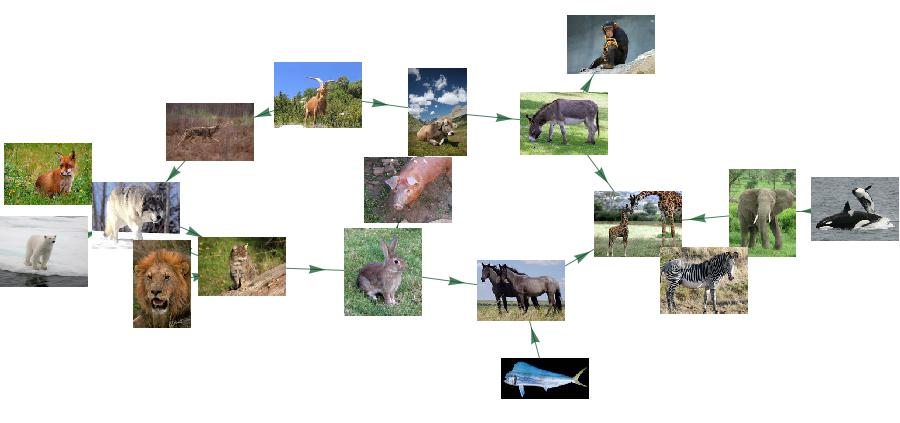
Please, give it a try. Later, we will see what the giant graph ends up looking like. Or even more fun, share with us your ideas or databins that you want to be filled out collaboratively!