Message Boards Message Boards

Mapping Total Solar Eclipse on March 20 2015

POSTED BY: Jeffrey Bryant
10 Replies

enter image description here -- you have earned Featured Contributor Badge enter image description here Your exceptional post has been selected for our editorial column Staff Picks http://wolfr.am/StaffPicks and Your Profile is now distinguished by a Featured Contributor Badge and is displayed on the Featured Contributor Board. Thank you!

POSTED BY: Moderation Team
POSTED BY: Vitaliy Kaurov

We can use nice new in WL10.1 function TimelinePlot function to show when and in what countries the total solar eclipse will be visible in the nex five years:

inter = {DateObject[{2015, 1, 1}], DateObject[{2020, 1, 1}], All}; 
times = SolarEclipse[inter, "MaximumEclipseDate", EclipseType -> "Total"];
polys = SolarEclipse[inter, "TotalPhasePolygon", EclipseType -> "Total"];
eclcou = GeoEntities[#, "Country"] & /@ polys;
TimelinePlot[Association[Thread[Column /@ eclcou -> times]],
  DateTicksFormat -> {"Day", " ", "MonthNameShort", " ", "YearShort"},
  Ticks -> {times, times}, Background -> GrayLevel[.9], BaseStyle -> 13, PlotTheme -> "Web"]

enter image description here

POSTED BY: Vitaliy Kaurov

So now when the eclipse is over and neither Peru or US got a glimpse, here is a photo for you folks from Ukraine I captured with a simple camera:

From Ukraine: photo and map of the solar eclipse Mar 20, 2015

POSTED BY: Vitaliy Kaurov

3D Sphere is easy. Once you have the image, rotate it:

enter image description here

Then run this code:

RevolutionPlot3D[{Sin[t], Cos[t]}, {t, 0, Pi}, Boxed -> False, 
 Axes -> False, Mesh -> None, Lighting -> "Neutral", 
 PlotStyle -> {Specularity[White, 10], Texture[i]}, 
 SphericalRegion -> True, PlotPoints -> 60, ViewAngle -> 0.3]

enter image description here

POSTED BY: Vitaliy Kaurov

Hi Matic, Please share the 3D Sphere :) ! Lou

POSTED BY: l van Veen

Even the partial view is very far from Peru!

GeoDistance[
 SolarEclipse[DateObject[{2015, 3, 20}], "PartialPhasePolygon", 
  EclipseType -> "Total"], Entity["Country", "Peru"]]
Quantity[3627.84, "Kilometers"]

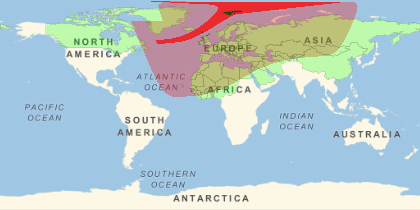
And you can highlight the countries using GeoEntities:

With[{total = 
   SolarEclipse[DateObject[{2015, 3, 20}], "TotalPhasePolygon", 
    EclipseType -> "Total"], 
  partial = 
   SolarEclipse[DateObject[{2015, 3, 20}], "PartialPhasePolygon", 
    EclipseType -> "Total"]}, 
 GeoGraphics[{GeoStyling[None], Opacity[.7], Red, total, Opacity[.3], 
   partial, Black, Opacity[.75], 
   Polygon /@ GeoEntities[total, "Country"], Green, Opacity[.25], 
   EdgeForm[{Black, Opacity[.1], Thin}], 
   Polygon /@ GeoEntities[partial, "Country"]}, 
  GeoProjection -> "Equirectangular", GeoRange -> All]]

total eclipse countries

Francisco, do not despair, you will get a partial one in the next decade 2010 - 2020 !

dataT = SolarEclipse[{DateObject[{2020, 1, 1, 0, 0}], 
    DateObject[{2030, 1, 1, 0, 0}], All}, "TotalPhasePolygon", EclipseType -> "Total"];

dataP = SolarEclipse[{DateObject[{2020, 1, 1, 0, 0}], 
    DateObject[{2030, 1, 1, 0, 0}], All}, "PartialPhasePolygon", EclipseType -> "Total"];

GeoGraphics[{GeoStyling[None], Red, Opacity[.7], dataT, Orange, 
  Opacity[.3], dataP, Green, Opacity[.5], Polygon[Entity["Country", "Peru"]]}, 
 GeoProjection -> "Equirectangular", ImageSize -> 800]

enter image description here

POSTED BY: Vitaliy Kaurov
Posted 9 years ago

It would be most impressive if this could be seen on the 3D Sphere!

POSTED BY: Matic Lubej

Cool. It is neat to compare how accessible eclipses are now versus what I imagine things were like a thousand years ago. I guess they didn't even have a global map.

POSTED BY: Todd Rowland
Reply to this discussion
Community posts can be styled and formatted using the Markdown syntax.
Reply Preview
Attachments
Remove
or Discard

Group Abstract Group Abstract