Message Boards Message Boards

Train Detector - Where to Go Next?

Posted 9 years ago

I built a train detector (OK, I hooked up a microphone to a Raspberry Pi 2). I record CD quality sound (44.1 kHz) to a sound file and run it through a C program to perform a FFT. You can then easily detect the signature of train whistles from the frequency spectrum. I then record and display the data using a conventional Spring Boot / MySQL application. All of this is running on a Raspberry Pi 2 with a 32 GB sim card.

You can see it working at: Train Counter

Code is at: https://github.com/geocolumbus/traindetector

I've gotten as far as recording the time between trains, and now I want to predict when the next train will come. I think this is a classic statistics problem - "time between events" and "predict the probability of the next event". Any ideas on how to proceed?

Sample data are attached.

enter image description here

Attachments:
POSTED BY: George Campbell
14 Replies

We live close enough to several public crossings on a busy line to hear the warning signals (Morse Code 'W' - long, long, short, long) as the trains approach and enter the level-crossings.

I observe each engineer has a 'style' involving the cadence and sound level. It's not as pronounced as with steam whistles (where tones change with the amount of steam flowing through the whistles), but I'm sure you could determine which engineer is driving each train.

I'd be interested if this could be done on a Pi by learning the various "fists" (name from Morse Code world).

GlennP

POSTED BY: Glenn Peterson

The Pi is sampling at 44 kHz, so it has the resolution to detect the length and spacing of each individual horn blast. Pattern matching would then be a matter of software.

POSTED BY: George Campbell

Maybe you could use the new machine learning functions as statistical prediction is one of the things they are good for and your data easily gives them enough to train with.

George I have two questions:

  • Where is R-Pi mounted and what is a setup? Maybe you could post a photo?

  • Do you rewrite your data and how much data you already have?

POSTED BY: Vitaliy Kaurov

The pi is mounted in my rec-room. A long microphone cable snakes up into the attic. The microphone itself sits in the space offered by the aluminum ridge vent of the roof. I'll take some pictures next time I'm up there.

POSTED BY: George Campbell

"Are you aware that Wolfram Language runs on Raspberry Pi and is available there for free?" - I am going to load this when I get a chance. For one thing, I'd like to use the FFT available from Wolfram and ditch the custom C library. Secondly, I'd like to make use of the statistics tools. So I have some homework to do!

POSTED BY: George Campbell

Sounds like a fun project, it's definitely worth downloading Mathematica! You can fit your histogram to various distributions (and find the best fit), calculate the expected time between trains, probability of a train coming the next x minutes (based on time from last train) etc. If the noise of axles going thru gaps in the tracks is loud enough, you might even be able to count the # of axles of each train and estimate tonnage of cargo going by your house - could be a good economic indicator, or you could get the speed of the train if you know axle separation (by finding the auto correlation) :)

POSTED BY: Kay Herbert

How did I connect the microphone? I give some hardware details in the "C" file comments on Github:

https://github.com/geocolumbus/traindetector/blob/master/c/listen.c

Thanks for looking at all this.

POSTED BY: George Campbell

Hi everyone - thanks for the interest.

This is a freight line, so the trains do not run on a schedule. Instead, demand, crew availability and line capacity all play a complex role. And yet the distribution of minutes between trains seems to fall into a Poisson Curve shape (I do remember my sophomore stats a little bit).

Raw data: https://dl.dropboxusercontent.com/u/8515698/train/train.csv

These are timestamps representing a minute wherein a train horn was heard (what if 2 trains come at the same time? Counts as one so far as the rPi can tell - but doesn't happen often). Since data and time are unwieldy, I included the posix time column, which is the seconds since 1/1/1970. It is useful for calculating differences.


Moderators' note: Data also attached to this post below and to the top original post.

Attachments:
POSTED BY: George Campbell

George a very cool project, indeed! Are you aware that Wolfram Language runs on Raspberry Pi and is available there for free. There is a whole group here dedicated to applications on R-Pi and Wolfram.

But do not trains run by schedule? Are you trying to gather stats on how late they are? Or are these cargo trains?

POSTED BY: Sam Carrettie

George, this is a very nice project you got going. For those who would like to take a stab at modeling. I extracted the main info I think - the time series of differences in seconds between the trains. Data are below - simply copy and paste in the notebook for modeling.

data = Import["train.csv", "CSV"];
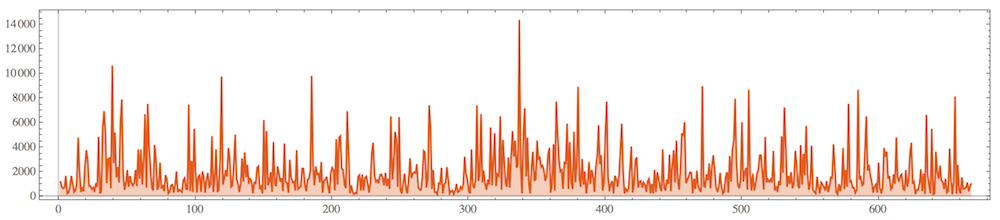
times = data[[3 ;;, 3]];
diff = Differences[times]

{1259,780,660,720,1680,240,301,780,1679,1080,360,480,1080,4800,2160,360,660,420,2460,3780,3060,
840,840,600,720,360,1080,780,4861,239,420,5581,6959,5220,1080,3060,3120,660,10680,2701,5220,1559,
2400,1141,6119,7920,1800,540,1020,2161,779,1680,1141,899,1080,2160,840,3841,1439,3841,959,3000,
6720,720,7561,3960,2279,720,480,4200,3120,541,839,2760,721,839,420,1741,1439,240,360,900,960,300,
960,2040,360,541,479,360,1320,1500,601,599,7501,419,2880,361,5519,2040,300,1620,1741,359,2040,
1560,300,1380,1920,780,960,4920,360,1441,3839,360,540,3060,9780,960,1440,2160,1620,3961,3119,780,
900,2700,5040,1440,1080,360,960,3120,1200,3600,1561,2579,1020,1500,1200,240,1140,1080,2340,2461,
599,780,240,6240,540,5340,900,1261,1979,360,4440,1020,841,2459,1920,1201,1499,420,4320,1201,1079,
300,3000,1561,1139,1200,480,3780,600,721,840,2280,2280,959,420,1380,1441,2159,9840,2520,900,2461,
1799,1860,1140,2820,300,1260,1381,1619,780,240,1920,2341,2159,481,4679,961,4799,4920,2280,2160,960,
660,6960,3720,240,900,360,181,300,239,1620,1740,480,1800,480,1500,1621,1079,300,1140,3600,4381,
1800,1199,1320,1080,1740,1800,1501,899,1920,840,1440,600,6541,1379,2461,5279,4680,780,6481,479,240,
1140,1860,660,240,1380,3121,1499,1860,1981,1919,2640,780,540,541,1559,3721,3599,720,1440,7441,5699,
600,2161,359,360,181,1079,1021,2339,240,960,1140,2400,1380,241,419,480,181,480,1020,359,421,779,
600,1021,3239,1860,1380,420,241,3839,901,660,1379,7440,1260,1741,6719,1140,2101,1019,540,1380,960,
5640,900,2760,5160,840,1801,1679,6540,541,4620,2879,1080,780,3180,721,3240,5339,3241,4559,2340,
2580,14400,2400,240,5280,7201,1620,4799,1020,240,2460,3661,1319,1380,4560,3060,3180,2400,2521,2159,
1261,1680,3419,3960,300,1021,4259,480,7740,5280,3060,2040,2160,600,2760,2700,5940,600,4440,1141,599,
5280,1140,2580,8940,1500,780,3060,960,2041,240,1019,2820,1020,2161,1619,361,2400,3240,5820,2639,3360,
480,1080,5280,7740,1560,420,1020,1260,240,1681,1439,780,1680,3780,5940,2100,240,600,420,660,2340,
4080,300,1021,2999,3180,720,1200,1261,719,1140,961,360,1259,1440,240,1020,240,2160,361,1980,1440,779,
420,3840,720,480,1381,1019,3420,420,2520,3780,1140,4561,1379,540,2280,5161,4919,6060,1080,1320,1680,
1980,1920,240,1440,601,2100,839,541,360,8999,840,781,1800,1319,2700,660,2460,3360,2280,780,360,780,
1920,840,241,359,1561,1980,299,3300,1200,3780,4561,7979,2700,961,659,1380,6060,1201,1919,2340,541,8699,
1800,480,1860,481,1019,1860,2160,3360,3360,1860,540,4860,1140,1380,1200,1380,1140,3720,480,841,360,1260,
899,4920,1920,7261,4440,780,1679,1020,1980,660,1081,3719,2760,900,660,4200,961,3479,1741,5759,1861,539,
1080,4140,540,361,239,1620,780,240,1140,960,780,481,1260,359,780,1561,1499,4260,2461,359,181,1020,420,
1019,3960,600,2160,780,7560,1200,1260,720,720,300,540,8700,1380,1561,900,1019,3660,6540,2101,2579,1740,
1200,300,780,960,300,2760,661,239,780,3960,3240,3660,1440,1681,599,720,1800,1020,4801,1559,1200,1680,
1800,600,540,2160,781,1319,3540,4381,1020,1199,180,541,540,1079,2220,420,1861,179,6660,1741,900,240,5520,
179,240,3660,1980,1440,2520,1320,1201,599,1440,300,420,3901,1440,179,1140,8160,240,2580,480,241,1560,599,
660,720,1140,420,841,1079}

ListLinePlot[diff, PlotTheme -> "Scientific", AspectRatio -> 1/5, 
 ImageSize -> 900, PlotRange -> All, Filling -> Bottom]

enter image description here

POSTED BY: Vitaliy Kaurov

A first interesting observation. We have an interesting and for now experimental function FindDistribution When it ran on various parts of data it suggests that data are distributed according to WeibullDistribution or LogNormalDistribution distributions. And guess what? This are the usual suspects for wind speed distributions, for example see:

Mixture probability distribution functions to model wind speed distributions

Please do not post of issues with FindDistribution here - it is marked EXPERIMENTAL in documentation and under development

Still FindDistribution works very nicely. Some insights are below. The data diff are taken from the post above.

head = FindDistribution[diff[[;; 400]]]

WeibullDistribution[0.952215, 1868.28, 180.648]

tail = FindDistribution[diff[[400 ;;]]]

LogNormalDistribution[7.10678, 0.923829]

his = Histogram[diff, 60, "ProbabilityDensity", 
   ChartElementFunction -> "GradientScaleRectangle", PlotTheme -> "Detailed"];

plo = Plot[{PDF[head, x], PDF[tail, x]}, {x, 0, 10000}, 
   PlotStyle -> {Directive[Thick, Red], Directive[Thick, Black]}, 
   PlotRange -> All, PlotTheme -> "Detailed"];

Show[his, plo, ImageSize -> 700, PlotRange -> {{1, 10000}, All}]

enter image description here

POSTED BY: Vitaliy Kaurov

Wow - now there's a connection I would have never made! I read up on Weibull Distributions on Wikipedia and it does mention that they are of use in industrial engineering for "manufacturing and delivery times". I should be able to calculate some probabilities based on the curve parameters, such as "The probability of a train appearing in the next 10 minutes." - I think there's an iPhone App idea if that could be made to work. Thanks for processing the data - it is fascinating!

POSTED BY: George Campbell

Maybe you could do this with Predict[] given day of week and time of day as input, assuming trains run on some kind of schedule? Otherwise maybe intervals (time since last train) for night/day/weekend?

BTW your detector is cool. Could you share how you connected a microphone to the RPI?

POSTED BY: Kay Herbert
Reply to this discussion
Community posts can be styled and formatted using the Markdown syntax.
Reply Preview
Attachments
Remove
or Discard

Group Abstract Group Abstract