Message Boards Message Boards

New graphic notation to express math relationships

Hi, my name is Joseph. I'm new here, but I've known wolfram's technologies since some years ago. Please forgive me if I make some spelling mistakes, my english is not perfect.

I've worked some years ago to develop a new way to express math relationships. I believe there must be another simpler and smarter way to express math, without disregarding the natural beauty of it. Eventually, I developed a simple math notation that, I think, fits my expectations and goals.
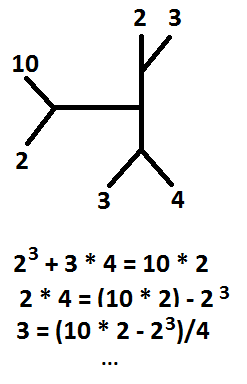
(This diagram express all those equations below it, and even more.)

I also believe it has some unexpected adventages over traditional math notation:

  • Order of operations is explicit; it's a non linear notation (it is diagram-based).
  • Variable isolation to transform equations to other equivalent forms, is not requiered.
  • Many orthodox equations can be represented at the same time using just a simple expression in this new notation.
  • This new notation has less operators.

You can actually see the specification here (GItHub). More general information here.

I have not found another similar way to express math, so I dream it will be useful for educators and scientsts, someday.

I open this thread because I need your opinion, criticism and scrutiny. This is a big and organized forum, so I believe there are many brilliant people with a honest opinion to give. Suggestions are all welcome, and this notation open to changes and improvements based on your reviews.

Thanks.


More examples
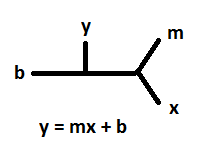
  • Slope-Intercept Form

enter image description here

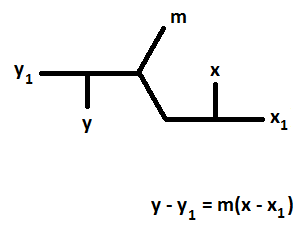
  • Point-Slope Form

enter image description here

POSTED BY: Joseph Anglada
6 Replies

Hi @Joseph Anglada, did you have any further progress with this?

POSTED BY: Marina Shchitova

Joseph have you had any progress on this? Seems like very interesting idea and you should probably look into Graph functionality.

POSTED BY: Vitaliy Kaurov
Posted 9 years ago

Hi Joseph,

I guess I'm a bit confused. In your first diagram, how can you infer that the upper 2 and 3 means 2^3 and not 2*3, 2+3, etc?

Also how does your idea scale with arbitrary functions? For example can you make a diagram for y = sin(2x)?

p.s. Have you seen the function TreeForm?

TreeForm[y == m x + b]

enter image description here

POSTED BY: Greg Hurst

Have you seen this example

neat example

and did you know that physicist Richard P. Feynman (a big diagramatic person, by the way) in his youth used to use his own symbolics because he felt the official (common-sense) notation awkward and confusing ... later on the wish to be understood and to be able to communicate with others let him switch back to the usual notation (invented on its own by some mindful people, too) ...

POSTED BY: Udo Krause

This probably could be implemented in Wolfram Language. Do you have any code for this - I have not seen any Mathematica files in your linked GitHub repository.

Another question. How do you suggest dealing with self-overlapping branches for large enough expressions? First thing that comes to mind is scaling down the branch size on deeper tree levels.

POSTED BY: Vitaliy Kaurov
POSTED BY: Joseph Anglada
Reply to this discussion
Community posts can be styled and formatted using the Markdown syntax.
Reply Preview
Attachments
Remove
or Discard

Group Abstract Group Abstract