Hello, I am beginner of mathematica. Today I tried to test plot function and I couldn't see my plot .
How can I see that?
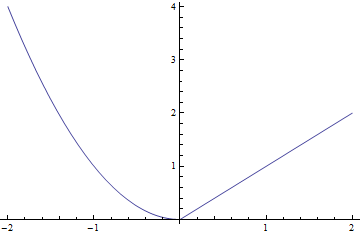
When I read your comment i stayed with the next question, why does your chart is different from a parable", I did it with the following code, and indeed i graph a parable, i am showing you what I did.
Eventually, the problem was resolved.
f[t_] := t^2 Plot[f[t], {t, -2, 2}]