Hi,
I wanted to help, but do not understand what your problem is. The explanation in your post is rather short. You say something about a rectangular signal, but then you show some code, and the result is not unexpected for me. So I am to really sure what it is you want and why you think there is a problem and what you have tried. It would also help to have some figures in the post.
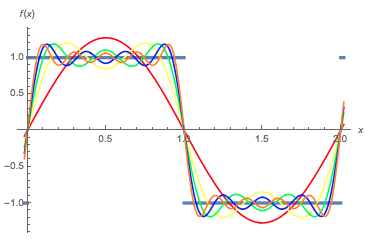
Do you want something like this (modified from Mathworld):
(series = Rest[FoldList[Plus, 0, Table[Sin[n Pi x]/n, {n, 1, 9, 2}]]] 4/Pi) // ColumnForm // TraditionalForm
and
Plot[Evaluate[{
   2 UnitStep[x] - 2 UnitStep[x - 1] + 2 UnitStep[x - 2] - 1,
   Sequence @@ series
   }], {x, -.02, 2.02},
 PlotStyle -> {Thickness[.01], Red, Yellow, Green, Blue, Orange},
 PlotRange -> All, AxesLabel -> TraditionalForm /@ {x, f[x]}]
It would help if you were to state your problem more clearly. Some more background will help you to get more answers.
Cheers,
Marco


