Hi I'm trying to produce some simple plots that require scientific notation for both the x and y axes. The y axes look fine when saved as pdfs but the x axes lose some of the symbols, systematically. Where on-screen a tick mark might say 4.0 x 10⁻³ (where the -3 would be properly a power of the 10), when saved out it renders as "4.0*^-3"
The y axis is correct. I cannot for the life of me figure out why. Any ideas? Getting publishable quality plots is always hard.
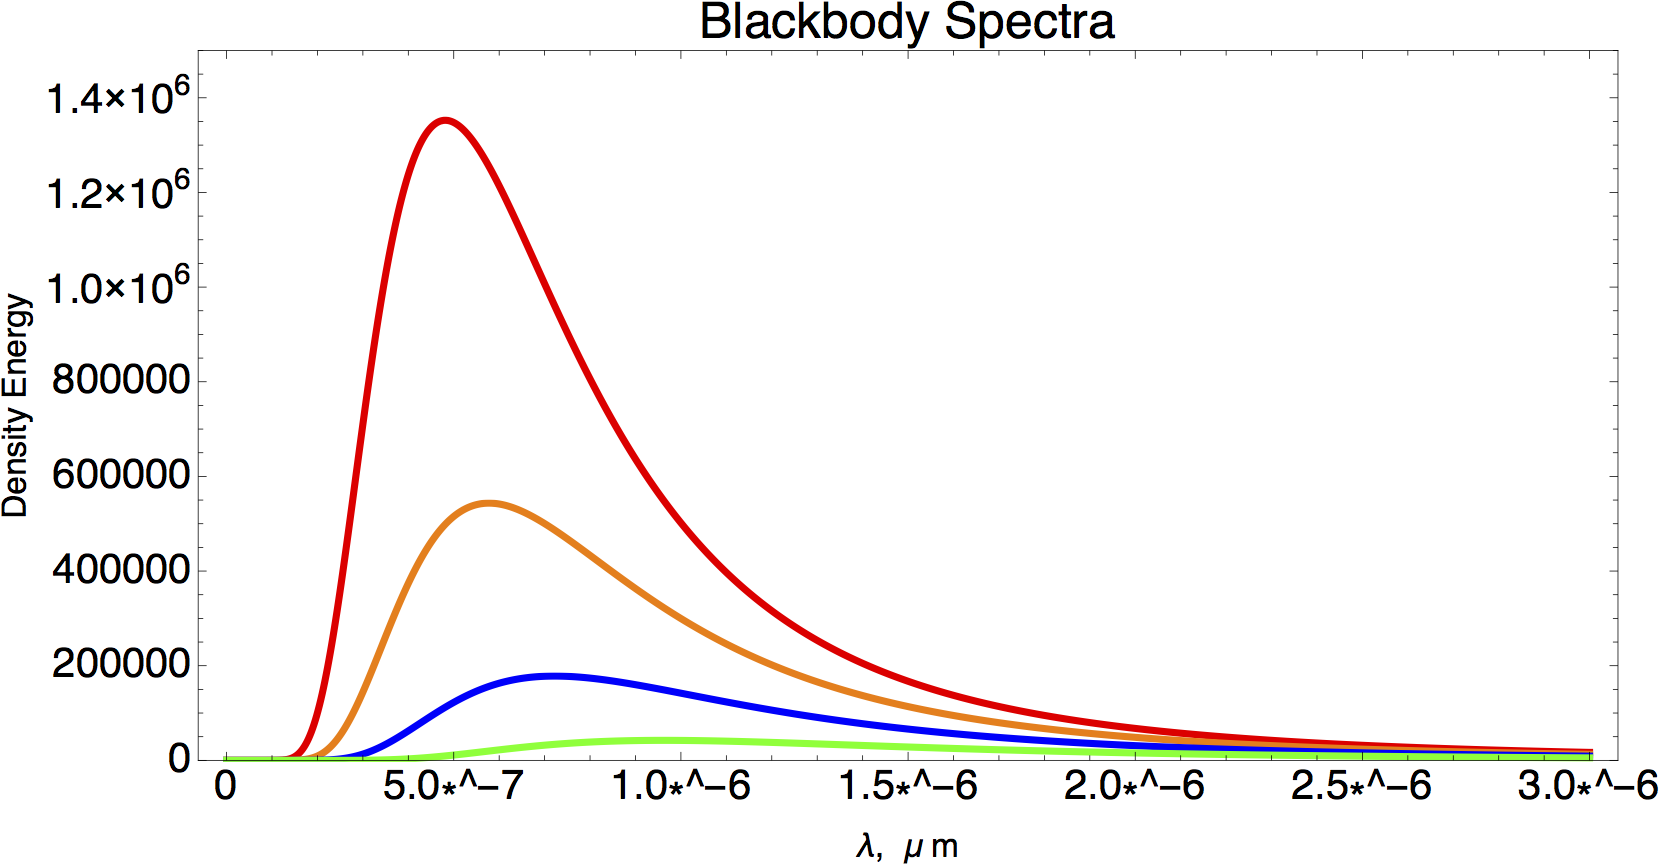
The code is below and an image is attached. The axis should be m and not \mu m BTW.
thanks Ray
Here's the simplest code known to man...
Plot[{uull[l,6000],uull[l,5000],uull[l,4000],uull[l,3000]},{l,1/10^10,3/10^6},
PlotStyle->{{Thickness[0.005`],Red},{Thickness[0.005`],Orange},{Thickness[0.005`],Blue},{Thickness[0.005`],Green}},
PlotRange->{0.`,15 100000},
FrameLabel->{{Style[Energy Density,16,
FontFamily->"Helvetica"],None},{Style["\[Lambda],  \[Mu] m",16,
FontFamily->"Helvetica"],None}},
GridLines->None,
FrameTicksStyle->Directive[Black, 20,
FontFamily->"Helvetica"],Frame->True,
PlotPoints->1000,AspectRatio->0.5`,
ImageSize->800,
PlotLabel->Style["Blackbody Spectra",24,
FontFamily->"Helvetica"],
PlotLegends->Placed[{"6000 K","5000 K","4000 K","3000 K"},Above]]