Hi All,
I minimised my code:
tmp = {{"2015-09-03T19:28:30", 51313}, {"2015-09-04T11:03:06", 51336}};
DateListPlot[tmp, ImageSize -> {450, 300}, ImagePadding -> {{40, 5}, {40, 5}}, AspectRatio -> Full]
Which gives me:
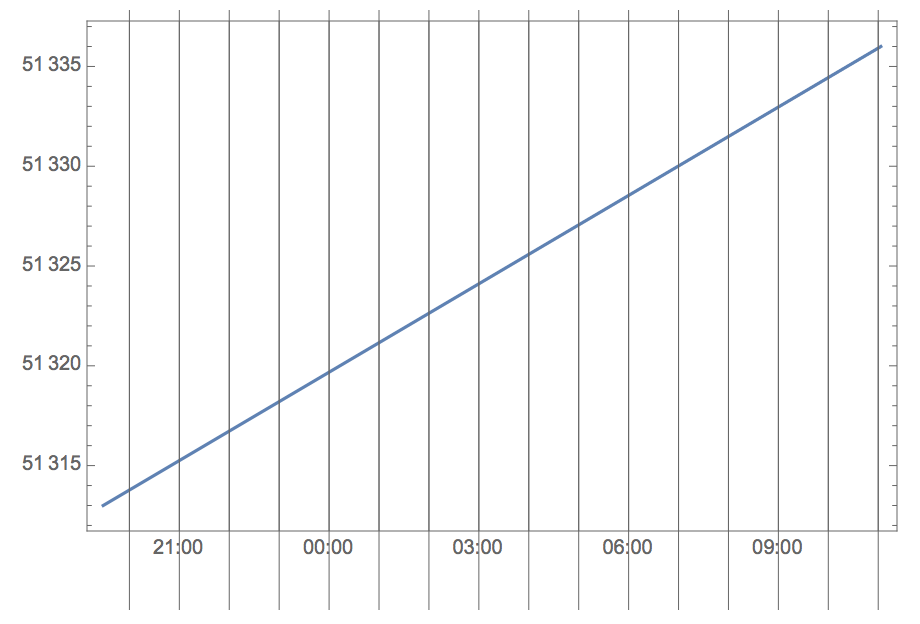
These are very large ticksmarks!!! (No, they are not gridlines!). I've been using Mathematica for a while, but I think this is some kind of bug. Anyone a solution?


