Message Boards Message Boards

0
|
3532 Views
|
1 Reply
|
1 Total Likes
View groups...
Share
Share this post:
GROUPS:

Wrong marker in ListLinePlot when PlotRange is given

Posted 9 years ago

Hi,

I encountered the following issue and I am unsure what the cause is:

When ListLinePlot is used with the PlotRange option and data points are outside of the PlotRange, then marker appear at the upper and lower boundary. Additionally these markers belong to the wrong line.

Here an example:

data = {{0, 1, 2, 10}, {0, 4, 1, 20}};    
ListLinePlot[data, PlotRange -> {{0, 4}, {0.5, 3}}, PlotMarkers -> {{"\[FilledCircle]", 20}, "\[FilledSquare]"}]

enter image description here

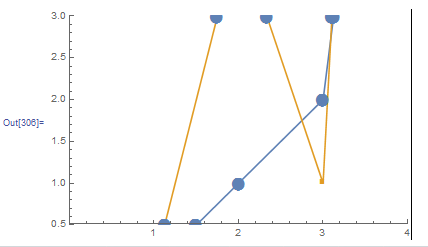
The blue dots are obviously wrong.. Any idea why this is happening?

Thanks!

POSTED BY: Frank N
Posted 9 years ago

This is a known bug, see this MMa.SE thread: "Unwanted PlotMarkers appear at non-existent places." Please report it to the tech support - it will increase the priority of this bug in the queue of bugs to be fixed. Currently the workaround is to add the ClippingStyle -> False option:

data = {{0, 1, 2, 10}, {0, 4, 1, 20}};
ListLinePlot[data, PlotRange -> {{0, 4}, {0.5, 3}}, 
 PlotMarkers -> {{"\[FilledCircle]", 20}, "\[FilledSquare]"}, ClippingStyle -> False]

plot

POSTED BY: Alexey Popkov
Reply to this discussion
Community posts can be styled and formatted using the Markdown syntax.
Reply Preview
Attachments
Remove
or Discard

Group Abstract Group Abstract