I recently switched from Mathematica Version 9 to Version 10, and I noticed that plots in ListLinePlot no longer seem to be filling the way they previously had. My aim is to fill a plot representing some average quantity from above with +standard error and from below with -standard error. For example, given 4 lists representing 4 different average quantities (list1, list2, list3, and list4) and positive and negative standard error bounds, the following code:
ListLinePlot[{list1, list1+seList1, list1-seList1, list2, list2+seList2, list2-seList2, list3, list3+seList3, list3-seList3, list4, list4+seList4, list4-seList4},
 DataRange -> {-0.2, 0.2}, PlotRange -> {{-0.2, 0.2}, {-0.2, 0.7}},
 Filling -> {1 -> {{2}, Directive[Opacity[0.2], Green]},
   1 -> {{3}, Directive[Opacity[0.2], Green]},
   4 -> {{5}, Directive[Opacity[0.1], Red]},
   4 -> {{6}, Directive[Opacity[0.1], Red]},
   7 -> {{8}, Directive[Opacity[0.2], Green]},
   7 -> {{9}, Directive[Opacity[0.2], Green]},
   10 -> {{11}, Directive[Opacity[0.1], Red]},
   10 -> {{12}, Directive[Opacity[0.1], Red]}},
 PlotStyle -> {{Darker[Green], Thickness[0.004]}, Transparent,
   Transparent, {Red, Thickness[0.004]}, Transparent,
   Transparent, {Darker[Green], Thickness[0.004], Dashed},
   Transparent, Transparent, {Red, Thickness[0.004], Dashed},
   Transparent, Transparent},
 FrameTicks -> {{LinTicks[-0.2, 0.7, MajorTickLength -> {0, .03},
     MinorTickLength -> {0, .01}],
    None}, {LinTicks[-0.2, 0.2, MajorTickLength -> {0, .03},
     MinorTickLength -> {0, .01}], None}},
 Frame -> {{True, None}, {True, None}}, Axes -> False,
 TicksStyle -> Thick, FrameStyle -> Thick]
Used to result in the following graph in Version 9: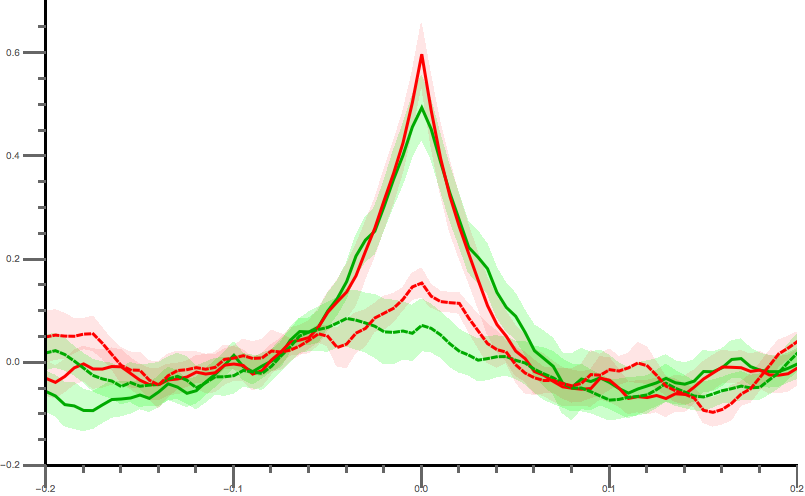
Now, however, the very same code in Version 10 results in the following graph: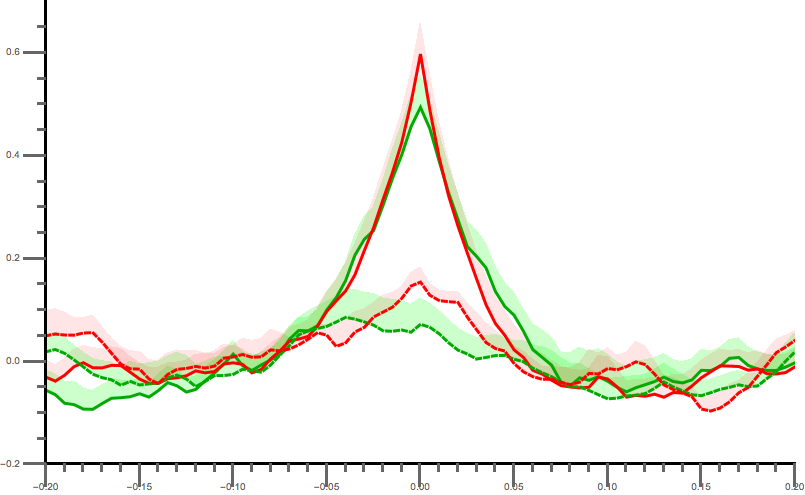
Notice how the region from the means to the means minus the standard errors are no longer filled. Switching the order that the means and the means plus/minus the standard errors are written in the list (i.e. {list1, list1-seList1, list1+seList1} instead of {list1, list1+seList1, list1-seList1}) fills in to the lower bound, but then the region to the upper bound is no longer filled in.
Has the Filling option changed the way it handles multiple lists in Version 10, or is this a bug?
Thanks!


