Message Boards Message Boards

1
|
4431 Views
|
3 Replies
|
1 Total Likes
View groups...
Share
Share this post:

Plotting solid regions in 3D

Posted 9 years ago

I would like to create a solid by using Graphics3D and PlotRange, however I want it to look as solid. I tried the following:

Graphics3D[{Gray, Opacity[1], Sphere[]}, PlotRange -> .8,  Axes -> True, Lighting -> "Neutral"]

enter image description here

But it is not solid, we can see inside the sphere. I need to plot regions of cuboids, cylinders, prims but looking as solid shapes.

Thank you

Vitaly

POSTED BY: Vitaly Esquerre
3 Replies

If you'd like to do regions you should read up docs on them. So perhaps you are looking for this?

RegionPlot3D[RegionIntersection[Ball[], Cuboid[-.8 {1, 1, 1}, .8 {1, 1, 1}]]]

enter image description here

To improve quality do something like:

RegionPlot3D[RegionIntersection[Ball[], Cuboid[-.8 {1, 1, 1}, .8 {1, 1, 1}]], 
PlotPoints -> 60, Lighting -> "Neutral", PlotStyle -> Gray, Axes -> True]

enter image description here

POSTED BY: Vitaliy Kaurov

Dear Vitaliy, thank you for your answer. That is the result I want to obtain. But, How to use it with spheres, cylinders or other 3d shapes instead of a ball?

What actually I want to do is to show a region of a crystal composed by hexagonal prisms elements but the boundaries are appearing transparent. I would like to show faces with the color of the shape. If you run the code, you will see two graphs at the end. The last one is the central region of the structure but it is not closed or solid.

Vitaly

Attachments:
POSTED BY: Vitaly Esquerre

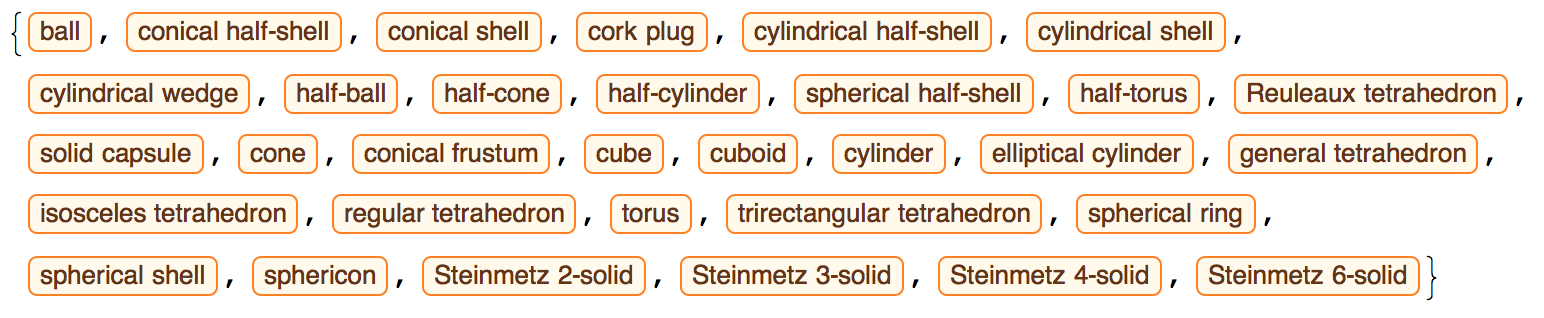
You can construct any region you need, read up the docs I referenced in my 1st post. There are many many ways to do this. Generally see ImplicitRegion for custom regions. There is also data. For example some SolidData:

SolidData[] 

enter image description here

enter image description here

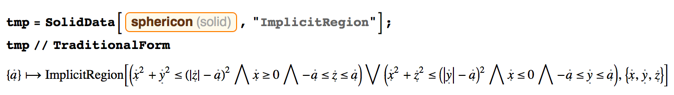
RegionPlot3D[tmp[1], PlotPoints -> 50, Boxed -> False]
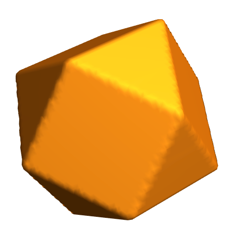
enter image description here

Or PolyhedronData:

With[{r = 1}, RegionPlot3D[
  PolyhedronData["Cuboctahedron", "RegionFunction"][x, y, z], {x, -r, r}, {y, -r, r}, {z, -r, r}, 
  Boxed -> False, Axes -> False, PlotPoints -> 50, Mesh -> None]]

enter image description here

POSTED BY: Vitaliy Kaurov
Reply to this discussion
Community posts can be styled and formatted using the Markdown syntax.
Reply Preview
Attachments
Remove
or Discard

Group Abstract Group Abstract