You can look at simulations (as Eric Rimbey shows) to see that a negative relationship is certainly possible and not unlikely (as Frank Kampas describes logically). Another way is attempting to work out out the appropriate integrals if you're feeling energetic. And one more way is to use a discrete distribution for
$X$,
$Y$, and
$Z$ and just enumerate all of the possibilities followed by the calculation of the correlation coefficient.
Suppose
$X$,
$Y$, and
$Z$ are independent of each other and uniform on the integers 1 through
$n$. We can write a function to enumerate the possibilities for (not too large) values on
$n$. Below is such a function.
corr[n_] := Module[{t, x, y, z, varyx, varzy, meanyx, meanzy, cov},

  (* Make a table of all possible values of y/x and z/y (and the product of y/x and z/y = z/x *)
  t = Flatten[Table[{y/x, z/y, z/x}, {x, 1, n}, {y, 1, n}, {z, 1, n}], 2];

  (* Calculate mean, variance, and covariance *)
  meanyx = Mean[t[[All, 1]]];
  varyx = Mean[t[[All, 1]]^2] - meanyx^2;
  meanzy = Mean[t[[All, 2]]];
  varzy = Mean[t[[All, 2]]^2] - meanzy^2;
  cov = Mean[t[[All, 3]]] - meanyx*meanzy;

  (* Now calculate correlation coefficient *)
  cov/(varyx^0.5 varzy^0.5)
  ]

(* Plot results for n going from 2 to 100 *)
ListPlot[Table[{i, corr[i]}, {i, 2, 100, 1}], Frame -> True,
 FrameLabel -> {{"Correlation coefficient", ""}, {"n", ""}}]
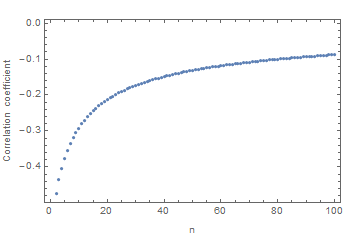
So the answer from this example is "Yes, the correlation can be negative." If you need a more global statement (such as "When the correlation exists for
$Y/X$ and
$Z/Y$, then the correlation will negative."), then more specifics about
$X$,
$Y$, and
$Z$ will be needed (assuming that statement is true).


