Message Boards Message Boards

1
|
8292 Views
|
6 Replies
|
2 Total Likes
View groups...
Share
Share this post:

Import displays Dicom Image differently in Mathematica 9 and 10

Posted 9 years ago

Mathematica 9 (windows 10: lenovo) displays image as:

enter image description here

Mathematica 10.2 (windows 10: Lenovo) displays image as:

enter image description here

Here is the source file:

Import["https://dl.dropboxusercontent.com/u/68983831/46405725"]

How to achieve same display as Mathematica 9? No code generated above image. Just the file was imported.

POSTED BY: John Reno
6 Replies

Hi. From my experience with PMOD it seems that the displayed window of units is read differently. I would try several things if you want to spent some time on the issue.

  1. Try to check the VALUE of the center of the white spot on that image on both versions of Mathematica. If the values are the same, so there is a rendering problem. If the values of the same point or area are different, maybe you read the values different way, for example WORD and REAL numbers.
  2. PMOD and many other programs, when reading DICOM files they do not respect the predefined window of the units. It is especially important in CT images, where for example for brain scans you would like to look at -10...100 HU, while the image range in total is -1000...1000 HU. Maybe two different Mathematica versions treat the image in different way.
  3. Check if the SAME version of Mathematica on different machines render the image the same way. Some DICOM reading programs tend to remember the unit window.

Hope that helps.

Marcin

POSTED BY: Marcin Balcerzyk

Hi John,

I have no idea how the difference in versions of Mathematica could play a role. Actually this should not be like this. Looking into the DICOM-header of your file using

dcmHeader = Import["https://dl.dropboxusercontent.com/u/68983831/46405725", "MetaInformation"];

makes me believe that somehow this file is corrupt. One can still see a lot of information, e.g. that the data were acquired by a Siemens MR Verio, but there also seems to be a lot of unreadable garbage in there - but I may be wrong.

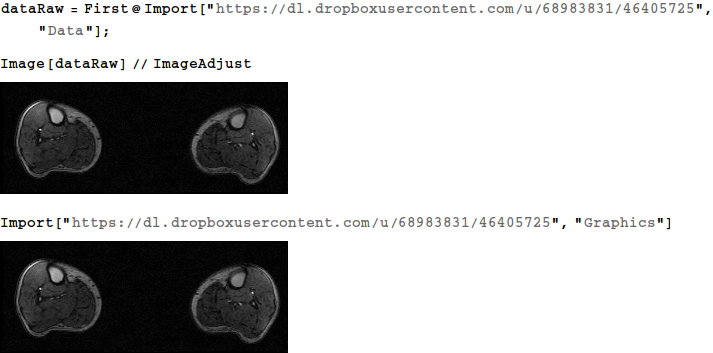
Anyway, you can extract (or at least I could extract) a better image by importing as "Data" or as "Graphics":

enter image description here

PS: My System:

In[53]:= $Version    
Out[53]= "10.2.0 for Linux x86 (32-bit) (July 6, 2015)"

Regards -- Henrik

POSTED BY: Henrik Schachner

Addendum:

The version of Mathematica does in fact make the difference:

enter image description here

Here we get an image with 125 different gray levels; using MMA v10 (in this case!) we get much less. Maybe somebody from WRI can comment on this.

POSTED BY: Henrik Schachner

Hm... okay... I have no idea, sorry. I get the same image as your Mathematica 10.2 output (using 10.3, Windows 10), so at least it looks like a general problem (as opposed to just a strange setting or graphics issue in some part of your system). Perhaps you can convert the image to a different format in another application, but that's probably not what you want. You could also try playing around with contrast settings and other image processing functions, although I'm not sure you'd get a solution that will work for future images without adjustment. Sorry I can't be of more help here.

POSTED BY: Bianca Eifert

Could you post the code that generated this image? That might be helpful. (Or a simplified example that behaves the same way, maybe something from the Documentation.) Is that on the same machine before and after upgrading, or on two different computers?

POSTED BY: Bianca Eifert
Posted 9 years ago

Please see updated question. First image was generated on windows 7 (acer) and 2nd image is generated in windows 10 (lenovo).

POSTED BY: John Reno
Reply to this discussion
Community posts can be styled and formatted using the Markdown syntax.
Reply Preview
Attachments
Remove
or Discard

Group Abstract Group Abstract