Your query seems ambiguous as to whether you want the first 100 primes or only those primes whose values are less than 100. I'll assume the latter meaning.
That's a rather complicated query you're trying to pose to Wolfram!Alpha. Try a simpler one first—just ask for a plot of those primes. Even that is tricky to request.
You'll get an error if you ask merely "plot primes from 1 to 100", as Wolfram!Alpha will try to use the function Prime and evaluate it at inputs such as 1.00202, which make no sense.
"plot primes between 1 and 100 increment 1" works. (Oddly, Wolfram!Alpha says the interpretation is "plot primes between 1 and 100"!)
I don't know, though, what additional query will add the graph of y=x to the result.
In Mathematica itself, what you ask is easy to do. One way is:
  p = ListPlot[Prime[Range[100]]];
  g = Plot[x, {x, 1, 100}];
  Show[{p, g}]
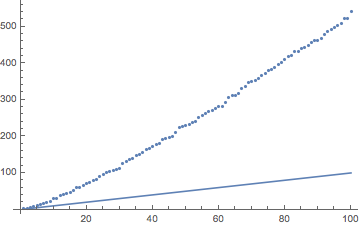
Note that the ListPlot expression will produce a plot of the 1st through the 100th prime, that is, with an x-coordinate up to 541. However, the Plot expression restricts x to a maximum of 100.


