I make up a set up data in the form of a csv file for working with, like the one in your example:
fileText = "Country,Date,Value
  Albania,01/01/2005,345.65
  Albania,01/01/2006,453.45
  Bangladesh,01/01/2005,34.65
  Bangladesh,01/01/2006,45.45";
Then I make an 'a', using SemanitcImportString to simulate reading your file:
a = SemanticImportString[fileText, {"Country", "Date", "Number"}]
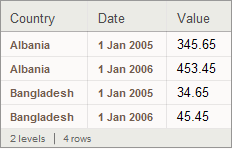
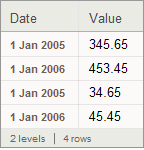
What you are now working with is a Dataset:
a[All, {"Date", "Value"}]
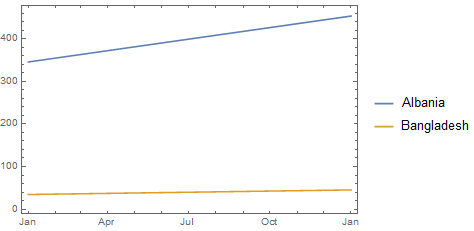
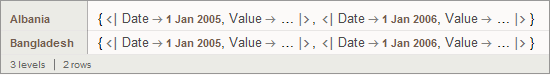
What DateListPlot wants is separate timeseries, one for each Country:
a[GroupBy["Country"], All, {"Date", "Value"}]
DateListPlot[a[GroupBy["Country"], All, {"Date", "Value"}]]