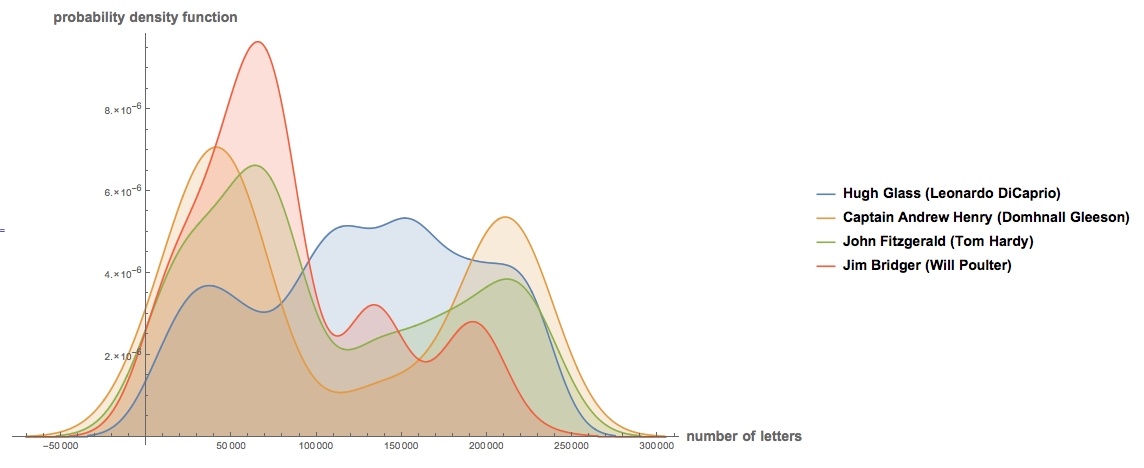
In this post I show how to create this BubbleChart representing the average words/minute and rating of the movie (the bigger the diameter of the bubble is, the better is the movie) and also show a simple way of building story flow visualization with SmoothHistogram. For the story flow you can take a look at this short tutorial Story Flow in Alice or even try coding it in a few lines in open cloud.
Finally last Sunday Leonardo DiCaprio won his first Oscar with "The Revenant". He did many other great movies before, but the golden statuette always escaped from his hands. Here I will try to visualize his career trajectory by comparing his movies.
In order to compare his movies I will use three variables for each movie: the year of its release, the average words/minute and its rating (taken from IMDb).
The first thing that we need to do is to import the script of each movie (you can download the english subtitles in many sites). Let's import the ones for "Inception":
SetDirectory[NotebookDirectory[]];
srt = Import["inception-yify-english.srt", "Text"];
The format of the script is the following:
"21
00:03:15,486 --> 00:03:18,447
Yes. In the dream state,
your conscious defenses are lowered...

22
00:03:18,615 --> 00:03:21,033
...and that makes your thoughts
vulnerable to theft."
So, we need to do some text processing in order to get a string with all words only:
partitions = StringSplit[srt, "\n"];
blocks = Flatten[Position[StringSplit[srt, "\n"], ""]];
script = Flatten[Table[Table[i, {i, blocks[[j]] + 3, blocks[[j + 1]] - 1}], {j, Length[blocks] - 1}]];
stringsrt =  StringDelete[StringJoin[Flatten[Map[partitions[[#]] &, script]]], {Shortest[  "[" ~~ x___ ~~ "]"]}];
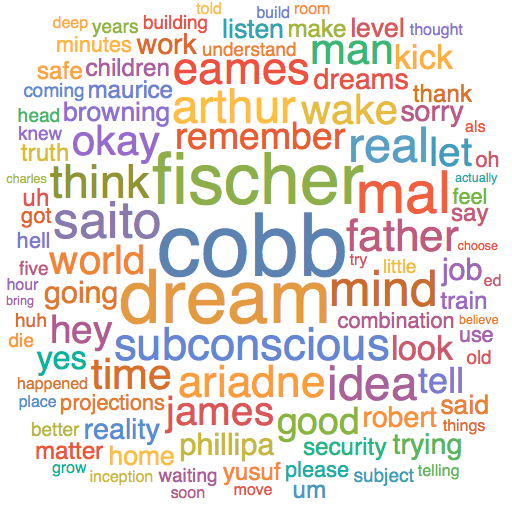
Now, we can do for example a WordCloud of the movie:
WordCloud[DeleteStopwords[stringsrt], ScalingFunctions -> (#^.1 &)]
But what we actually want is the StringLength of the script, so we can estimate the average words/minute later on:
StringLength[stringsrt]
68719
Repeating the same for the rest of the movies, we can finally create the BubbleChart that appears on top of the page:
bubbleChart = Framed[Labeled[BubbleChart[<|"This Boy's Life 7.3" -> {1993, 45901/(4.79 115), 7.3},
     "What's Eating Gilbert Grape 7.8" -> {1993, 45000/(4.79 118), 7.8},
     "The Basketball Diaries 7.3" -> {1995, 45996/(4.79 102), 7.3},
     "Total Eclipse 6.5" -> {1995, 29078/(4.79 111), 6.5},
     "Romeo+Juliet 6.8" -> {1996, 41022/(4.79 120), 6.8},
     "Titanic 7.7" -> {1997, 64681/(4.79 194), 7.7},
     "The Man in the Iron Mask 6.4" -> {1998, 34450/(4.79 132), 6.4},
     "The Beach 6.6" -> {2000, 42965/(4.79 119), 6.6},
     "Gangs of New York 7.5" -> {2002, 53011/(4.79 167), 7.5},
     "Catch Me If You Can 8.0" -> {2002, 62683/(4.79 141), 8.0},
     "The Aviator 7.5" -> {2004, 83739/(4.79 170), 7.5},
     "The Departed 8.5" -> {2006, 74151/(4.79 151), 8.5},
     "Blood Diamond 8.0" -> {2006, 49529/(4.79 143), 8.0},
     "Body of Lies 7.1" -> {2008, 58444/(4.79 128), 7.1},
     "Revolutionary Road 7.3" -> {2008, 45111/(4.79 119), 7.3},
     "Shutter Island 8.1" -> {2010, 55156/(4.79 138), 8.1},
     "Inception 8.8" -> {2010, 61824/(4.79 148), 8.8},
     "J. Edgar 6.6" -> {2011, 75697/(4.79 137), 6.6},
     "The Revenant 8.2" -> {2016, 29250/(4.79 156), 8.2},
     "Django Unchained 8.5" -> {2012, 68719/(4.79 165), 8.5},
     "The Great Gatsby 7.3" -> {2013, 67586/(4.79 143), 7.3},
     "The Wolf of Wall Street 8.2" -> {2013, 128803/(4.79 180), 8.2}
     |>,
    ChartLabels -> Automatic,
    ChartStyle -> {RGBColor[0.915, 0.3325, 0.2125, 0.89], RGBColor[
      1, 0.75, 0, 0.92], RGBColor[
      0.28026441037696703`, 0.715, 0.4292089322474965, 0.93],
      RGBColor[0.363898, 0.618501, 0.782349], RGBColor[
      0.40082222609352647`, 0.5220066643438841, 0.85, 0.92], RGBColor[
      0.528488, 0.470624, 0.701351, 0.9], RGBColor[1, 0.58, 0, 0.89],
      RGBColor[0.647624, 0.37816, 0.614037, 0.9400000000000001],
      RGBColor[0.40082222609352647`, 0.75, 0.85, 0.87], RGBColor[
      0.736782672705901, 0.358, 0.5030266573755369,
       0.9400000000000001], RGBColor[
      0.8200000000000001, 0.09, 0.89, 0.81]},
    PlotTheme -> "Detailed",
    ImageSize -> 1300,
    BubbleSizes -> {0.05, 0.3},
    Background -> RGBColor[0.29, 0.29, 0.29, 0.97],
    FrameLabel -> {Style["Year", 24, Bold],
      Style["words / minute", 24, Bold]},
    LabelStyle -> {RGBColor[0.93, 0.93, 0.93, 0.97], 14,
      FontFamily -> "Helvetica", Bold}],
   Style["Leonardo DiCaprio Movies", 30, RGBColor[1, 0.86, 0, 0.85],
    FontFamily -> "Helvetic", Bold], Top], FrameMargins -> 25,
  Background -> RGBColor[0.27, 0.27, 0.27, 0.97]]


