Message Boards Message Boards

0
|
2854 Views
|
0 Replies
|
0 Total Likes
View groups...
Share
Share this post:

Oscillation in experimental data due to a signal or noise?

Posted 8 years ago

I have some experimental data which is well-fitted by 40 terms of a Fourier series.

enter image description here

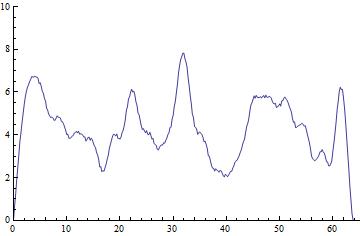
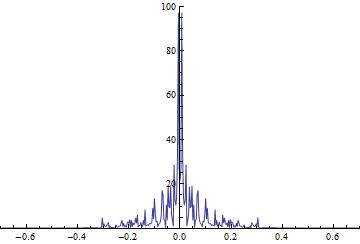
I want to know if the oscillation exhibited is signal or noise. I evaluated the code shown below to plot my data in the frequency domain:

enter image description here

Thanks for your help, in advance!

Attachments:
POSTED BY: mim Far
Reply to this discussion
Community posts can be styled and formatted using the Markdown syntax.
Reply Preview
Attachments
Remove
or Discard

Group Abstract Group Abstract