Shifting Lands
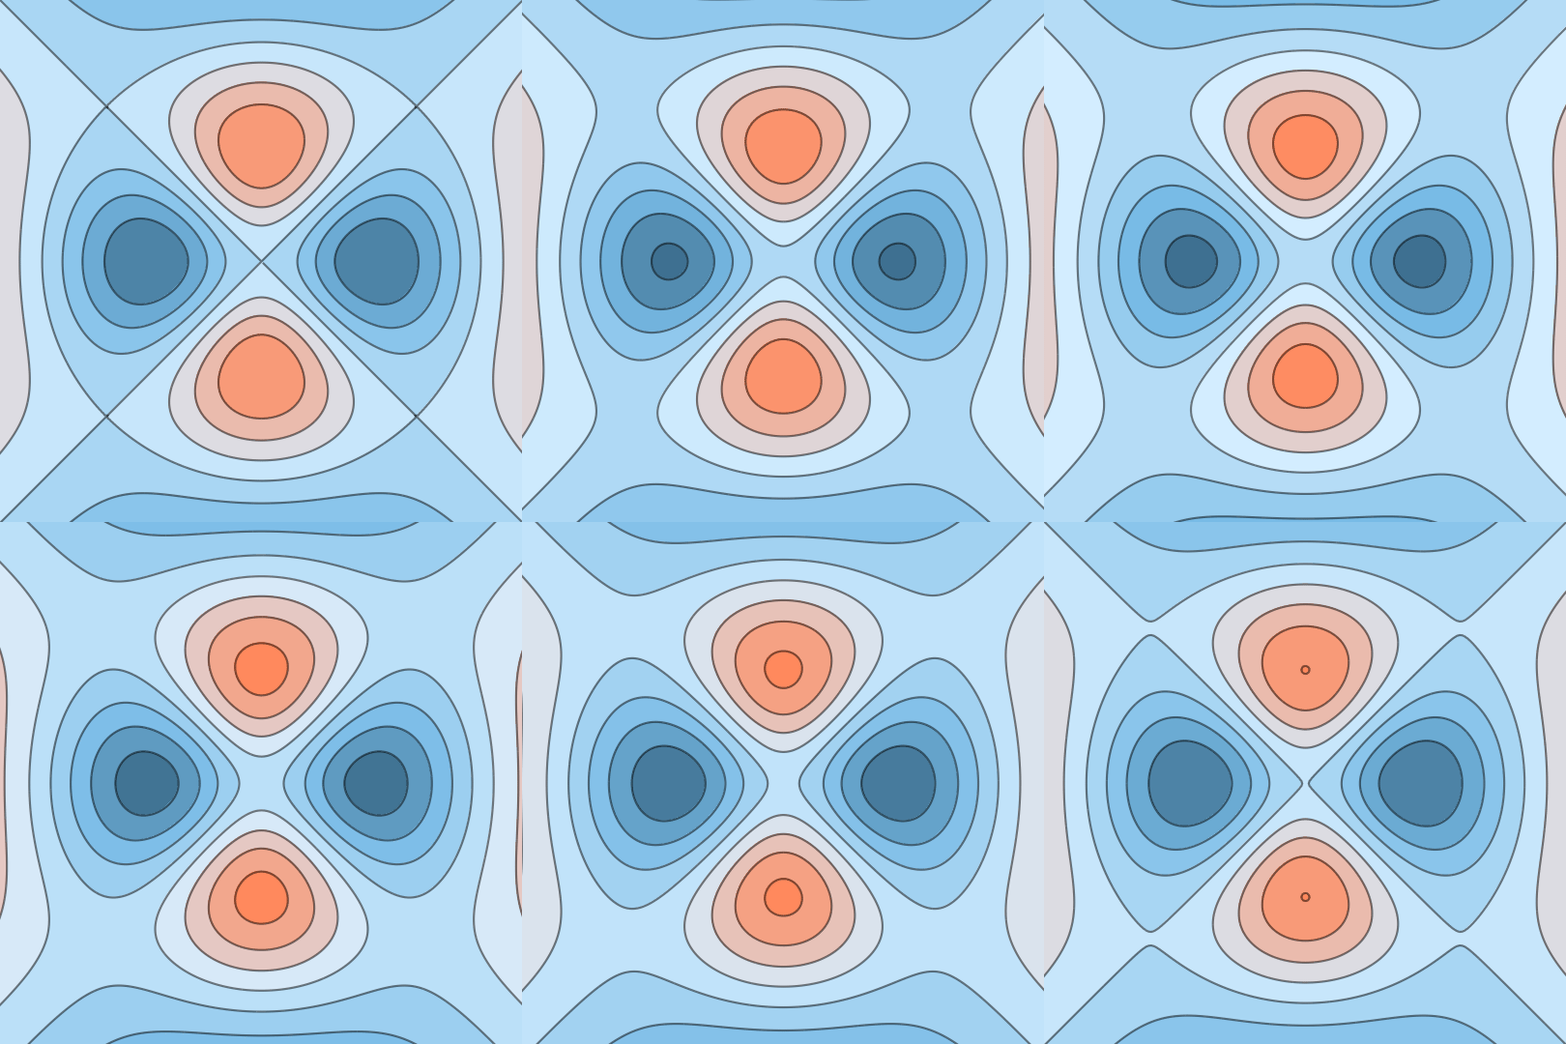
Same idea as before: this shows the stereographic image of the level sets of a function on the unit sphere; in this case, the function $f(x,y,z)=xyz$.
Here's the code (you can make the Manipulate more responsive but worse-looking by reducing PlotPoints):
Manipulate[
 ContourPlot[(
  2 (x - y) (x + y) (-1 + x^2 + y^2))/(1 + x^2 + y^2)^3, {x, -1.2,
   1.2}, {y, -1.2, 1.2}, Axes -> None, Frame -> False,
  ImageSize -> 540, Background -> GrayLevel[.97],
  ContourStyle -> Thickness[.004], PlotPoints -> 100,
  PlotRangePadding -> -0.01, ColorFunctionScaling -> False,
  ColorFunction -> (Blend[
      RGBColor /@ {"#1B435D", "#78BBE6", "#D5EEFF", "#FF895D"},
      1/8 + 7/8 * 3 Sqrt[3]/2 (# + 1/(3 Sqrt[3]))] &),
  Contours ->
   Table[r + t, {r, -1/(3 Sqrt[3]) - 2/(12 Sqrt[3]),
     1/(3 Sqrt[3]) + 2/(12 Sqrt[3]), 1/(12 Sqrt[3])}]], {t, 0.,
  1/(12 Sqrt[3])}]