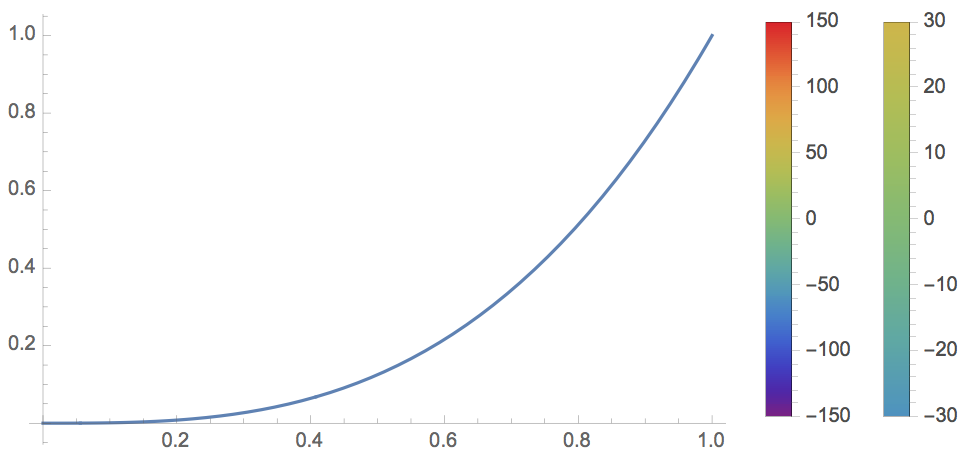
I have attached an image that I found online and accurately shows what I am trying to do. I have a huge range of values, most of which are aroud 0, and a few outliers are very large.
Here is a basic construct:
Legended[
 Plot[x^3, {x, 0, 1}], Row[
  {
   BarLegend[{"Rainbow", {-150, 150}}],
   BarLegend[{ColorData["Rainbow", 1/2 + #/150] &, {-30, 30}}]
   }
  ]
 ]
creating:
You can use that and customize it...