Message Boards Message Boards

0
|
5362 Views
|
3 Replies
|
0 Total Likes
View groups...
Share
Share this post:

Color Code 3D Plot?

Posted 8 years ago

Take the following:

ParametricPlot3D[{{x, Re[I^x], Im[I^x]}}, {x, -4, 4}, 
 AxesLabel -> {Real x, Real y, Imaginary y}, PlotRange -> All]

enter image description here

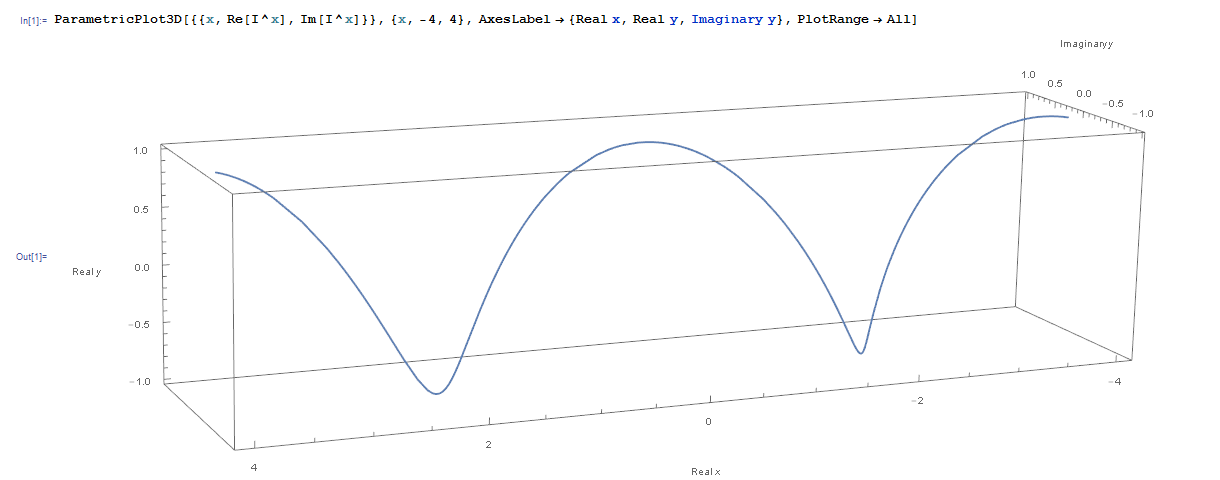
Would it be possible to color code this plot so that there is a red to blue gradient between the real and imaginary output, respectively? Basically, the color of the helical line curve should appear red at the x values (such as -4, -2, 0, 2, and 4) that give no imaginary output while it should appear blue at the x values (such as -3, -1, 1 and 3) where it gives no real output. Some gradient of red and blue (purple) should appear in between, such as at x=(1/2) since the real and imaginary parts are equal.

Basically, wherever the real part is greater, more red should be used, while whenever the imaginary part is greater, more blue should be used.

POSTED BY: John Travolski
3 Replies

In general, each of the #ii is a Slot, which is an argument to a pure function. In your case, the three slots correspond to the three dimensions of the plot; so if you want to do something with the x values, you'd use #1. You wanted to use the real and imaginary parts, so that #2 and #3, respectively, because that's how you set up the plot. Abs[#2 + I*#3] is simply the absolute value of I^x since that's how you deconstructed the function values. (It's the same as Sqrt[#2^2+#3^2], if you'd rather spell it out.) The outer Abs just makes sure that positive and negative function values are treated the same way.

POSTED BY: Bianca Eifert
Posted 8 years ago

That works wonderfully! Thank you. However, I'm not sure how your ColorFunction actually works. If I wanted to apply this idea to more complex plots 3D parametric plots, would the function Abs[#2/Abs[#2 + I*#3]] still work? For example, I don't understand the significance of multiplying I by #3. Would that mean anything if I was using 3D parametric plots with only real numbers?

POSTED BY: John Travolski

How about something like this? The curve is colored according to the ratio of the real part to the absolute value. This gives a balanced colouring, but you can play around with the ColorFunction more.

ParametricPlot3D[
 {{x, Re[I^x], Im[I^x]}}, {x, -4, 4},
 AxesLabel -> {"Real x", "Real y", "Imaginary y"},
 PlotRange -> All,
 ColorFunction -> (Blend[{Blue, Red}, Abs[#2/Abs[#2 + I*#3]]] &),
 ColorFunctionScaling -> False
 ]

enter image description here

POSTED BY: Bianca Eifert
Reply to this discussion
Community posts can be styled and formatted using the Markdown syntax.
Reply Preview
Attachments
Remove
or Discard

Group Abstract Group Abstract