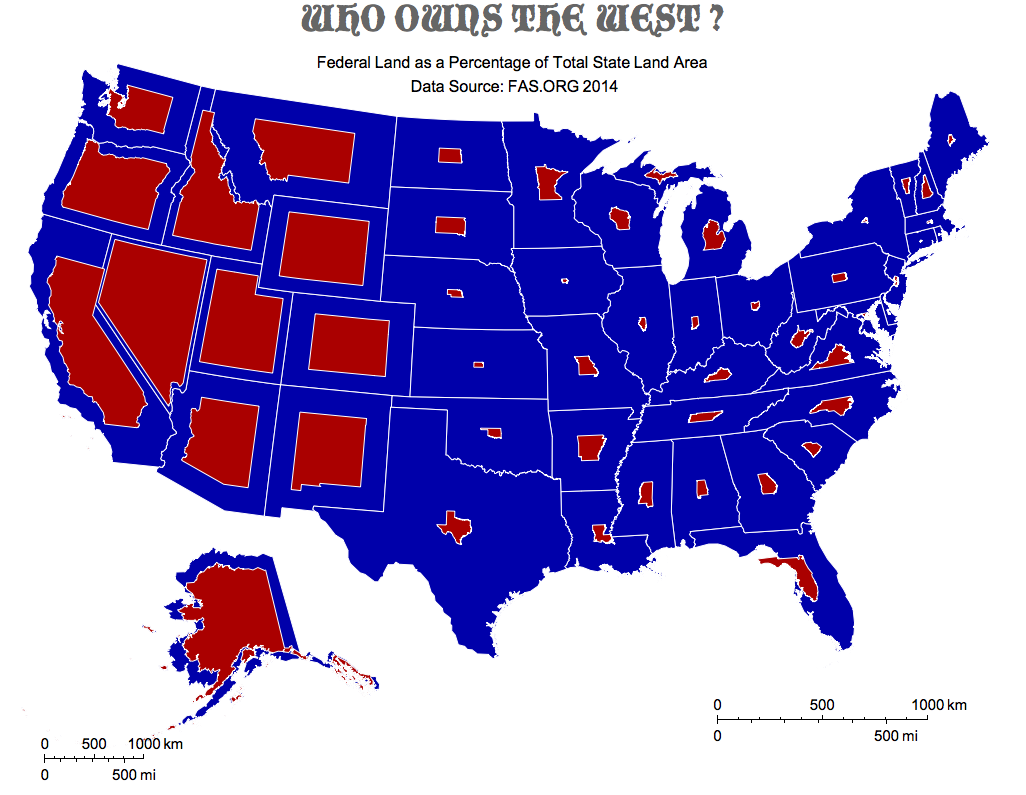
This map is a spectacular example of how data reshape public perception and knowledge. Very simple in nature it nevertheless shocks an average citizen by giving clarity to the data usually buried in obscure tables. East versus west, federal versus private, - the contrast is sharp and reverberates in the minds entangled with American history. The map achieved "viral" status in social media and keeps resurfacing into the spotlight. I first saw it in a Big Think article. One Reddit discussion gained 1380 votes and 276 comments. First this map appeared in Stanford Alumni Magazine in the article Can the West Lead Us to a Better Place? by David M. Kennedy. The original fas.org data source pinpoints the issue:
Federal land ownership is concentrated in the West. Specifically, 61.2% of Alaska is federally owned, as is 46.9% of the 11 coterminous western states. By contrast, the federal government owns 4.0% of lands in the other states. This western concentration has contributed to a higher degree of controversy over land ownership and use in that part of the country.
Throughout Americas history, federal land laws have reflected two visions: keeping some lands in federal ownership while disposing of others. From the earliest days, there has been conflict between these two visions. During the 19th century, many laws encouraged settlement of the West through federal land disposal. Mostly in the 20th century, emphasis shifted to retention of federal lands.
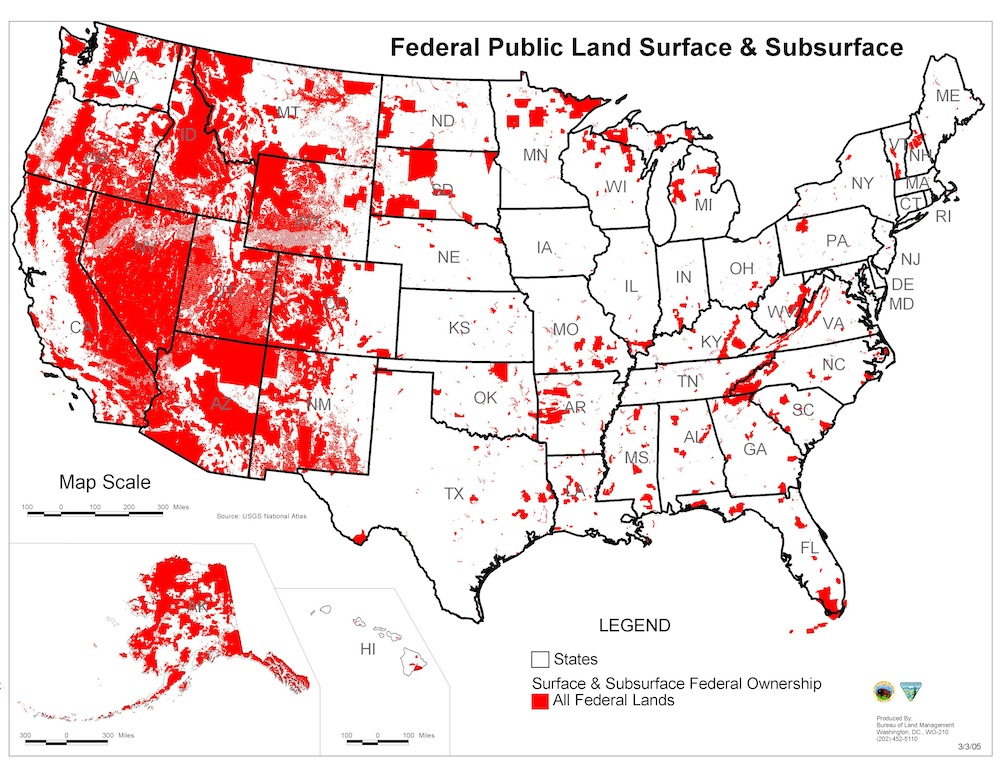
Those maps depict 2004 data, while the original data source keeps updating currently featuring 2014 information. I wanted to show how the basic features of the map can be recreated with Wolfram Geometric Computation and GIS functionality. While the original map has an air of handwork, I'd like to recreate the most of it programmatically, so one can outsource most of the labor of creating such maps to computational automation. Run the code and get the map!
The data can be easily copied from the fas.org .PDF document, and I attached them as an .xls document to this post. The WL code notebook is also attached and I assume both files are in the same folder on your computer. Let's first import the data:
SetDirectory[NotebookDirectory[]]
rawDATA = SemanticImport["FederalLandOwnership2014.xls"];
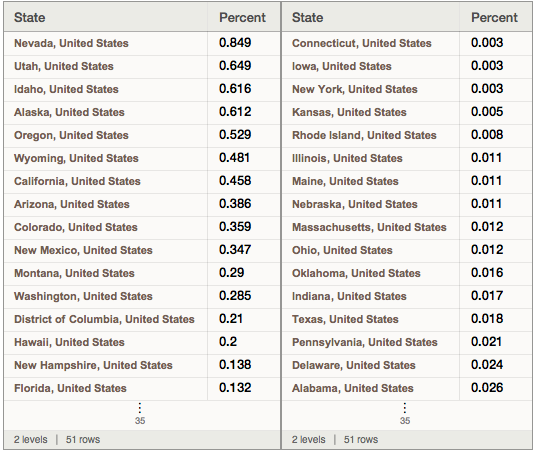
SemanticImport is using WL built-in interpreter to automatically convert USA states names (text strings) to Administrative Division Entity which contain numerous curated knowledge about the USA states. That's a nice WL feature of interaction between imported and built-in curated data. Let's see the sorted data's head and tail - the states owned by government in the most and the least:
Row[{rawDATA[SortBy[-#Percent &]], rawDATA[SortBy[#Percent &]]}]
Now I get the states' Entity, the federal area percentage, and the states' border polygons as separate variables:
states = Normal[rawDATA[All, "State"]];
percent = Normal[rawDATA[All, "Percent"]];
polygs = EntityValue[states, "Polygon"];
And now we arrive at the most important part of the code, - the design of the visualization. Obviously, I need to take a state polygone and shrink it proportionally to the federal ownership percentage. This is done in a few steps:
- Find RegionCentroid of a state polygon
- Translate the state polygon to the coordinate origin by subtracting RegionCentroid from the polygon coordinates
- Multiply (shrink) all polygon X and Y coordinates by $\sqrt{percent}$ (so the area ~ $\sqrt{percent}^2=percent$)
- Translate the state polygon to the original position by adding RegionCentroid back to the polygon coordinates
Here is a function that does these steps. Map is to account for the fact that each state polygon may consist of a few sub-polygons:
resc[pl_, s_] := Map[With[{rc = RegionCentroid[Polygon[#]]}, Transpose[s (Transpose[#] - rc) + rc]] &, pl]
Now I get the list of our shrinked polygons:
polygsRES = Polygon[GeoPosition[#]] & /@ MapThread[resc, {polygs[[All, 1, 1]], percent^.5}, 1];
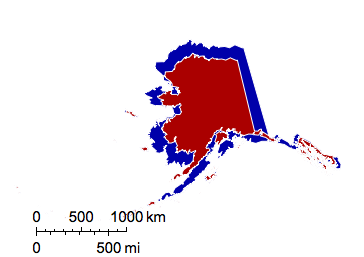
To create the final visualization we will need a few tricks. First of all we need the state of Alaska to be an inset in the final map, because indeed it is very "North to the future" ( Alaska State Motto ;-) ). As inset it will be rescaled and needs its own GeoScaleBar to reflect the true scale.
alas=GeoGraphics[{
{GeoStyling[Darker@Blue],EdgeForm[White],polygs[[2]]},
{GeoStyling[Darker@Red],EdgeForm[White],polygsRES[[2]]}},
GeoBackground->None,
GeoRangePadding->None,
GeoProjection->"LambertAzimuthal",
GeoScaleBar->{"Metric","Imperial"},
BaseStyle->15]
Now we ready for the final map. Look carefully through the options to learn a few formatting tricks. I decided not to show Hawaii, states labels and percentages, but this also could be done of course with a more elaborate code. This makes the image you saw at the very top of this post:
noalas=GeoGraphics[{
{GeoStyling[Darker@Blue],EdgeForm[White],polygs},
{GeoStyling[Darker@Red],EdgeForm[White],polygsRES},
Inset[alas,Scaled[{.2,.2}],Automatic,.3{1,1}],
Text[Style[
"Federal Land as a Percentage of Total State Land Area
 Data Source: FAS.ORG 2014",16],Scaled[{.5,.97}]]},
GeoBackground->None,
GeoProjection->"LambertAzimuthal",
GeoRange->{{20,50},{-120,-73}},
GeoScaleBar->Placed[{"Metric","Imperial"},Scaled[{.7,.1}]],
PlotLabel->Style["WHO OWNS THE WEST ?",40,FontFamily->"Blackmoor LET"],
BaseStyle->15]
I am also looking forward to a computational recreation of a more detailed visualization depicting physical lands exactly. For instance see Wikipedia article on Federal Lands. If anyone is aware of the data location please let me know in the comments.
As an epilog I'd like to cite the note on Current Federal Land Management:
The creation of national parks and forest reserves laid the foundation for the current federal agencies whose primary purposes are managing natural resources on federal lands. The four land management agenciesthe Forest Service, the National Park Service, the Fish and Wildlife Service, and the Bureau of Land Managementreceive funding through the annual Interior, Environment, and Related Agencies appropriations laws, as well as through various trust funds and special accounts. These four agencies were created at different times and their missions and purposes differ. In addition, the Department of Defense administers 14.4 million acres of federal land in the United States. Numerous other federal agenciesthe Bureau of Reclamation, Post Office, the National Aeronautics and Space Administration, the Department of Energy, and many moreadminister the remaining federal lands.
The Bureau of Land Management is related to the highly resonant with community Bundy Standoff story. It would be interesting to recreate computationally the map divided between federal agencies. The yellow color below marks the lands owned by Bureau of Land Management. Again please let me know if you are aware of the data sources.

Sources:
- How Much Land the Federal Government Owns Will Surprise You, Big Think
- Federal Land as a Percentage of Total State Land Area, Reddit
- Can the West Lead Us to a Better Place?, Stanford Alumni Magazine
- Federal Land Ownership: Overview and Data, FAS.ORG
 Attachments:


