Message Boards Message Boards

0
|
4512 Views
|
4 Replies
|
3 Total Likes
View groups...
Share
Share this post:

Plot / Manipulate 2 different points on 2 different plots?

Posted 8 years ago

For Manipulate / Plotting - How do I plot 2 separate points on 2 different plotted curves within same Manipulate?

Manipulate[Show[
  Plot[x^2, {x, 1, 10}, Epilog -> {PointSize[0.03], Point[{a, a^2}]}],
   Plot[1.5 x^2, {x, 1, 10}, Epilog -> {PointSize[0.03], Point[{b, 1.5 b^2}]}]], 
{a, 0, 10}, {b,0, 10}]
Attachments:
POSTED BY: Lea Rebanks
4 Replies

If your code is small it is better just to paste it in the post, as I do below. Is this what you need?

Manipulate[
Plot[{1.5x^2,x^2},{x,1,10},
Epilog->{PointSize[0.03],Point[{a,a^2}],Point[{b,1.5*b^2}]}],
{{a,5},0,10},{{b,5},0,10}]
POSTED BY: Vitaliy Kaurov
Posted 8 years ago

Many thanks Perfect. Really appreciate your help.

POSTED BY: Lea Rebanks

Move both of the Epilog points to be part of the Show rather than the individual plots

Manipulate[
 Show[
  Plot[x^2, {x, 1.`, 10.`}, PlotRange -> Automatic],
  Plot[1.5 x^2, {x, 1.`, 10.`}, PlotRange -> Automatic]
  , Epilog -> {PointSize[0.03], Point[{a, a^2}], PointSize[0.03], 
    Point[{b, 1.5*b^2}]}
  ], {a, 0, 10}, {b, 0, 10}]
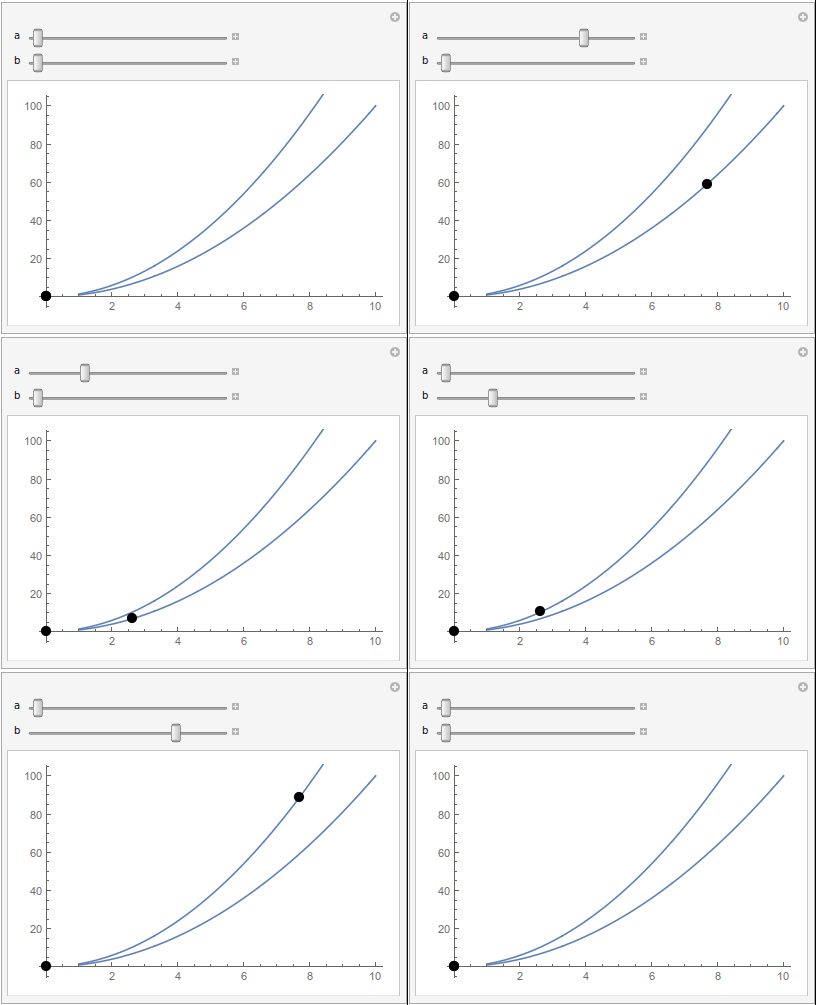
enter image description here

POSTED BY: Jason Biggs
Posted 8 years ago

Many thanks Perfect. Really appreciate your help.

POSTED BY: Lea Rebanks
Reply to this discussion
Community posts can be styled and formatted using the Markdown syntax.
Reply Preview
Attachments
Remove
or Discard

Group Abstract Group Abstract