Hi, I have these command lines, but I would like to increase the font size of the Legend. How i can do?
Needs["PlotLegends`"];
ListLinePlot[cpdiff[[All, All, All]],PlotRange -> All,  Frame->{{True,True},{True,True}},PlotLegend-> rapp, LegendPosition->{1,-0.4},PlotMarkers-> {Automatic,9},ImageSize->1000,
LegendShadow ->None,
 FrameLabel->{{ DCp,DCp },{obstacle perimeter," \[Alpha] = 0\[Degree]"}},
RotateLabel -> False, Axes ->True,AxesStyle->Directive[Black, Thick,Dashed],
FrameStyle->Directive[Black,Thick,Bold, FontSize->20], GridLines ->{{0.5,1,1.5,2,2.5,3,3.5,4},Automatic},
GridLinesStyle -> Directive[Gray, Dashed]]
this is the graphic 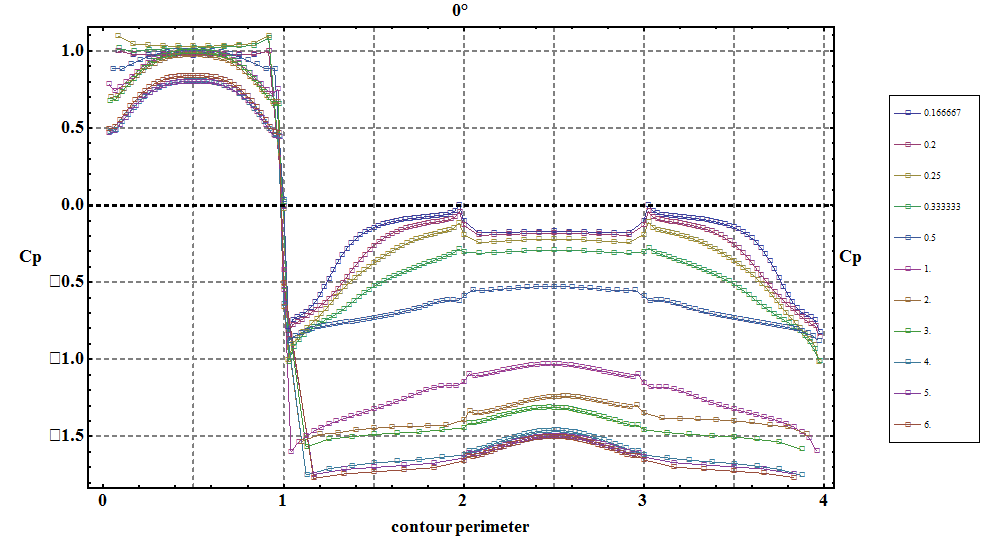
Thanks
Margherita


