Yes, it relates to Mathematica. Apologies for not being more specific. I am trying to use Mathematica to answer the questions below. We generate the first two iterations of the Mandelbrot Set with:
ContourPlot[{ Abs[x + I y] == 2, Abs[x + (x + I y)^2 + I y] == 2}, {x, -2, 2}, {y, -2, 2}]
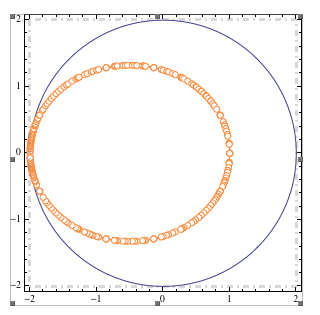
The first iteration is Abs(x + I y) = 2 . It corresponds to a simple circle, { x(t)= 2 Cos(t) , y(t)= 2 Sin(t) } .
Finding a parameterization { x(t) , y(t) } that corresponds to the 2nd iteration, Abs(x + (x + I y)^2 + I y) = 2 proves more difficult. (it's not an ellipse, though it looks like one).
Question 1: Right-clicking the plot allows you to Get Coordinates for one specific point. Is there a way to export a list of many coordinates for the curve? Quadruple clicking on the curve highlights many point on the curve.
How would we export the coordinates of those points to a list?
Question 2: Using Reduce can help us solve for x or y, for instance:
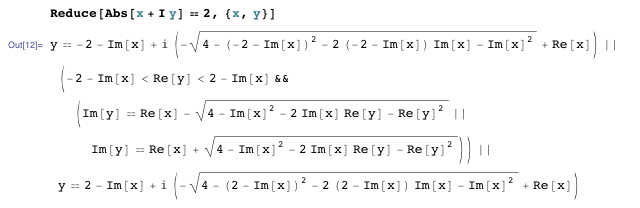 Yet somehow, y = (all that) is equivalent to 2 Sin(t) when mapping from {real, imaginary} to {x,y}. Does anyone know of a way to show that this is true ? I would think it's straightforward, since it's just a simple circle. But i'm lost. Thank you.


