Message Boards Message Boards

1
|
11675 Views
|
4 Replies
|
6 Total Likes
View groups...
Share
Share this post:

Create left and right axes ticks that are of different scales?

Posted 8 years ago

I have a plot showing two different curves with different units but with coinciding abscissa (time). I want to create ticks on the left corresponding to one set of units and a different set of ticks on the right. The point of the graph is to compare the temporal coincidence of the "spikes" in the two different curves. The curves represent data from an experiment.

POSTED BY: Erik Boczko
4 Replies
Posted 8 years ago

Below are two snapshots of an example of (using) the DPark's 'Presentations' package approach to multiaxis scales on 2D graphics.

A) The initial position

enter image description here

A moved position and corresponding new scales for the different magnitudes involved in the picture, absolute and relatives. The dynamic changes are dynamicaly reflected in the scales as the sliders are moved leftward and rightward. The number and values of the scales can become complex and, so, difficult to present with the standard Mathematica approach. Compare the DPark's code with that for 'TwoAxisPlot' and keep in mind that these pieces of code are about pretty tiny examples.

enter image description here

This can be made easily with DPark's package.

The 'Presentations' extension to graphics programming should be a must for Mathematica, it makes much (more) simpler, by far, the task of producing complex dynamic graphics like this one.

POSTED BY: E Martin

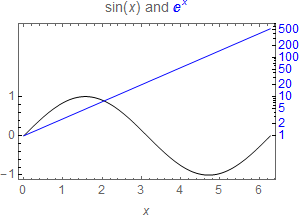
The following are two examples from my Presentations Mathematica application, which I sell for $50. You can contact me for more information, The first example uses a CustomTicks routine. It allows linear, log and date scales, and any monotonic mapping function. The details of the ticks and labeling can be controlled and minor ticks are also provided,

<< Presentations`
leftTicks = CustomTicks[Identity, {-1, 1, 1, 5}];
rightTicks = 
  CustomTicks[Log[10, #] &, {0, 2, {1, 2, 5}, {3, 4, 6, 7, 8, 9}}, 
   CTNumberFunction -> (Style[#, FontColor -> Blue] &)];
Draw2D[
  {Draw[f1[x], {x, 0, 2 \[Pi]}],
   Blue, Draw[Log[10, f2[x]], {x, 0, 2 \[Pi]}]},
  Frame -> True,
  FrameLabel -> {x, None, None, None},
  FrameTicks -> {{leftTicks, rightTicks}, {Automatic, Automatic}},
  PlotLabel -> Row[{f1[x], " and ", Style[f2[x], FontColor -> Blue]}],
  BaseStyle -> {FontSize -> 12},
  ImageSize -> 300]
enter image description here

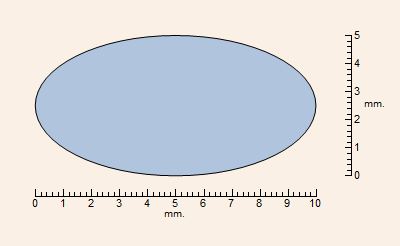
Here is a second example which can use any free standing linear scale.

Draw2D[
 {ColorData["Legacy"]["LightSteelBlue"], Disk[{0, 0}, {2, 1}],
  Black, Circle[{0, 0}, {2, 1}],

  XTickLine[{-2, 2, -1.3}, {0, 10}, {0, 10, 1}, 5,
   XNumberFunction -> (Style[#, 11, FontFamily -> "Helvetica"] &),
   XLabTickSpecs -> {0.032, 0},
   XUnLabTickSpecs -> {0.020, 0},
   XTextSpecs -> {{0, 1}, {1, 0}, 0.002}],

  YTickLine[{-1, 1, 2.5}, {0, 5}, {0, 5, 1}, 5,
   YNumberFunction -> (Style[#, 11, FontFamily -> "Helvetica"] &),
   YLabTickSpecs -> {0, 0.016},
   YUnLabTickSpecs -> {0, 0.010},
   YTextSpecs -> {{-1, 0}, {1, 0}, -0.01}],

  Text["mm.", {-0.00542015, -1.54438}],
  Text["mm.", {2.85, 0.0157696}]},

 AspectRatio -> Automatic,
 PlotRange -> {{-2.5, 3.2}, {-2, 1.5}},
 Background -> ColorData["Legacy"]["Linen"],
 ImageSize -> 400]
enter image description here

Posted 8 years ago

David, I tried to email you, but was stopped by SpamArrest. When I tried their verification, I just get server unavailable. Could you please email me? My contact info is in my profile.

Thanks and kind regards,

David

NEVER MIND. MY EMAIL HAS BEEN RELEASED, ALL CHARGES DROPPED, YOU SHOULD BE RECEINING IT!

POSTED BY: David Keith

If you're plotting functions with Plot, then you can use TwoAxisPlot defined here. If you are plotting lists using ListLinePlot, then use TwoAxisListPlot defined here

Those functions are a bit old, so I can't vouch that they work in modern MMA versions.... but if they fail, we could help with that

POSTED BY: Jason Biggs
Reply to this discussion
Community posts can be styled and formatted using the Markdown syntax.
Reply Preview
Attachments
Remove
or Discard

Group Abstract Group Abstract