When we are evaluating clustering for data classification, we can use Silhouettes. For each element in a cluster, we need to get its average dissimilarity measured against other elements in the same cluster ( $a(i)$) and the average dissimilarity against the nearest neighbor cluster ( $b(i)$). Dissimilarity can be any measure whose value increases with dissimilar elements and decreases with similar elements. An example of one of this measures is the Euclidean distance for numeric values. For each element in the data set we obtain a value $s(i)$ that can take values from -1 through 1. A $s(i)$ value of 1 means that the classification of element i in its current cluster is optimal. A $s(i)$ value negative is bad news, it means that element $s(i)$ doesn't belongs to the current cluster. $s(i)$ is calculated in this way: $s(i)=\frac{b(i)-a(i)}{max(a(i),b(i)}$
In the ideal case we want rectangular cluster Silhouettes of height 1, but well this is the ideal case, likely not the real.
In our study, we want to assess the quality of the clustering calculated by ClusterClassify using algorithm k-means. Our data are some measures that we use to quantify the behavior of Turing machines of 3-colors 3-states. We use just some samples of this machines due to that the whole space is enormous (around 200 billion). Our data set is comprised of 6000 Turing machines.
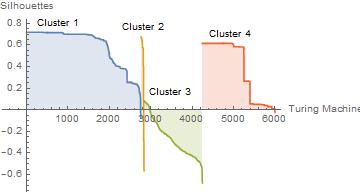
The image below shows cluster Silhouettes in a clustering of 4 partitions. We can see that clusters 1 and 4 have a good Silhouette; the greater proportion has high values for $s(i)$. However, cluster 2 has just a few elements with mixed results and to worsen cluster 3 could hardly do worse. Silhouette for cluster 3 shows us that almost every element doesn't belong there. With this, we can say that partitioning this data set in four classes of behavior is a bad choice. We would see another clustering with more clusters.
Our next Silhouette analysis is the case with five partitions. We can see improved results for this case, the mismatching cluster disappears. Although not everything is perfect, we now have a cluster with half of its elements well classified, but the other half doesn't belong there.For clusters 3 and 4, we can see that an element in each is misclassified; this doesn't affect significantly the overall Silhouette for those clusters.
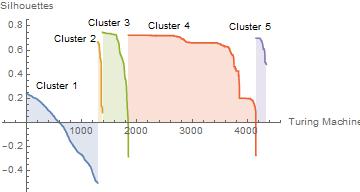
The average $s(i)$ for 4 and 5 partitions are 0.274735 and 0.455039, respectively. By visual inspection and quantification of Silhouettes, we can conclude that we can have a better classification with five clusters. To have an optimal value for the number of clusters, we have to follow the same analysis increasing the partition number.


