Message Boards Message Boards

Get the value of Nb that maximizes the function Pb? (ArgMax problem)

Posted 8 years ago

Hello I'm really new to mathematica... and I'm struggling for the following question.... What I want to do is to get the value of Nb that maximizes the function Pb

k[Nb_] := Nb - (1/(1 - f^2))*(1 + (f * Nb/(1 - Nb)))*(1 - (f*Nb)/(1 - Nb) Log[(1 - (1 - f)*Nb)/f]) 
Pb[Nb_] := (f*g + (1 - f)*g*k[Nb] - y*Nb + f*\[Pi])*Nb

And all the letter except Nb are taken as constant (0<f<1)

And I tried

ArgMax[{Pb[Nb], 0 < f && f < 1}, Nb]

However, the output is exactly the same as input

ArgMax[{Nb (f g - Nb/2 + f \[Pi] + (1 - f) g (Nb - ((1 + (f Nb)/(1 - Nb)) (1 - (f Nb Log[(1 - (1 - f) Nb)/f])/(1 - Nb)))/(1 - f^2))),0 < f && f < 1}, Nb]

I have no idea why mathematica gives the same output as input so I'm struggling to figure it out. The following is what I got from my mathematica. enter image description here

Can anybody help me solving the problem? Thank you

POSTED BY: Changseok Ma

Surely, it is mutually assumed that your parameters f, g, y, are numeric and fixed. To solve symbolically your problems is difficult. So, I propose to define your functions as it follows:
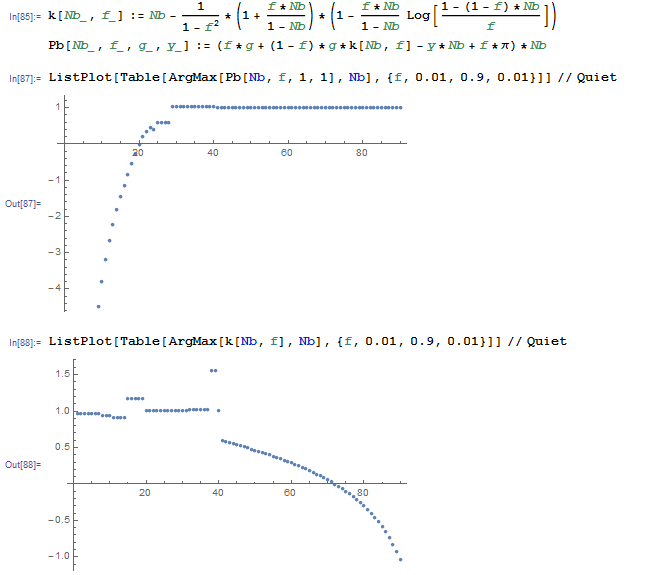
k[Nb_, f_] := 
 Nb - 1/(1 - 
    f^2)*(1 + (f*Nb)/(
     1 - Nb))*(1 - (f*Nb)/(1 - Nb) Log[(1 - (1 - f)*Nb)/f])
Pb[Nb_, f_, g_, y_] := (f*g + (1 - f)*g*k[Nb, f] - y*Nb + f*\[Pi])*Nb

It must be observed that in definition there is Log function... Right conclusions must be done... By fixing values of g=1 and y=1, we can tabulate the value of f and solve corespondent optimization problems. The results we can visualize by applying ListPlot:

ListPlot[Table[
   ArgMax[Pb[Nb, f, 1, 1], Nb], {f, 0.01, 0.9, 0.01}]] // Quiet

We can do the same thing for the function k[]:

ListPlot[Table[ArgMax[k[Nb, f], Nb], {f, 0.01, 0.9, 0.01}]] // Quiet

enter image description here

Evidently, now you have tools for doing your tests and continuing your research.

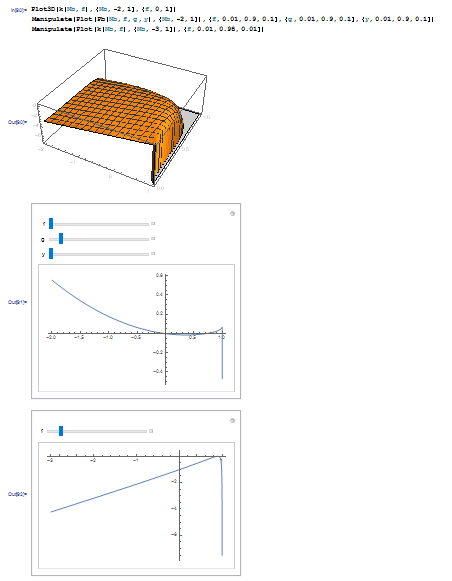
Additionally, you can analyze function graphs by their plots and manipulations:

Plot3D[k[Nb, f], {Nb, -2, 1}, {f, 0, 1}]
Manipulate[
 Plot[Pb[Nb, f, g, y], {Nb, -2, 1}], {f, 0.01, 0.9, 0.1}, {g, 0.01, 
  0.9, 0.1}, {y, 0.01, 0.9, 0.1}]
Manipulate[Plot[k[Nb, f], {Nb, -3, 1}], {f, 0.01, 0.98, 0.01}]

enter image description here

Reply to this discussion
Community posts can be styled and formatted using the Markdown syntax.
Reply Preview
Attachments
Remove
or Discard

Group Abstract Group Abstract