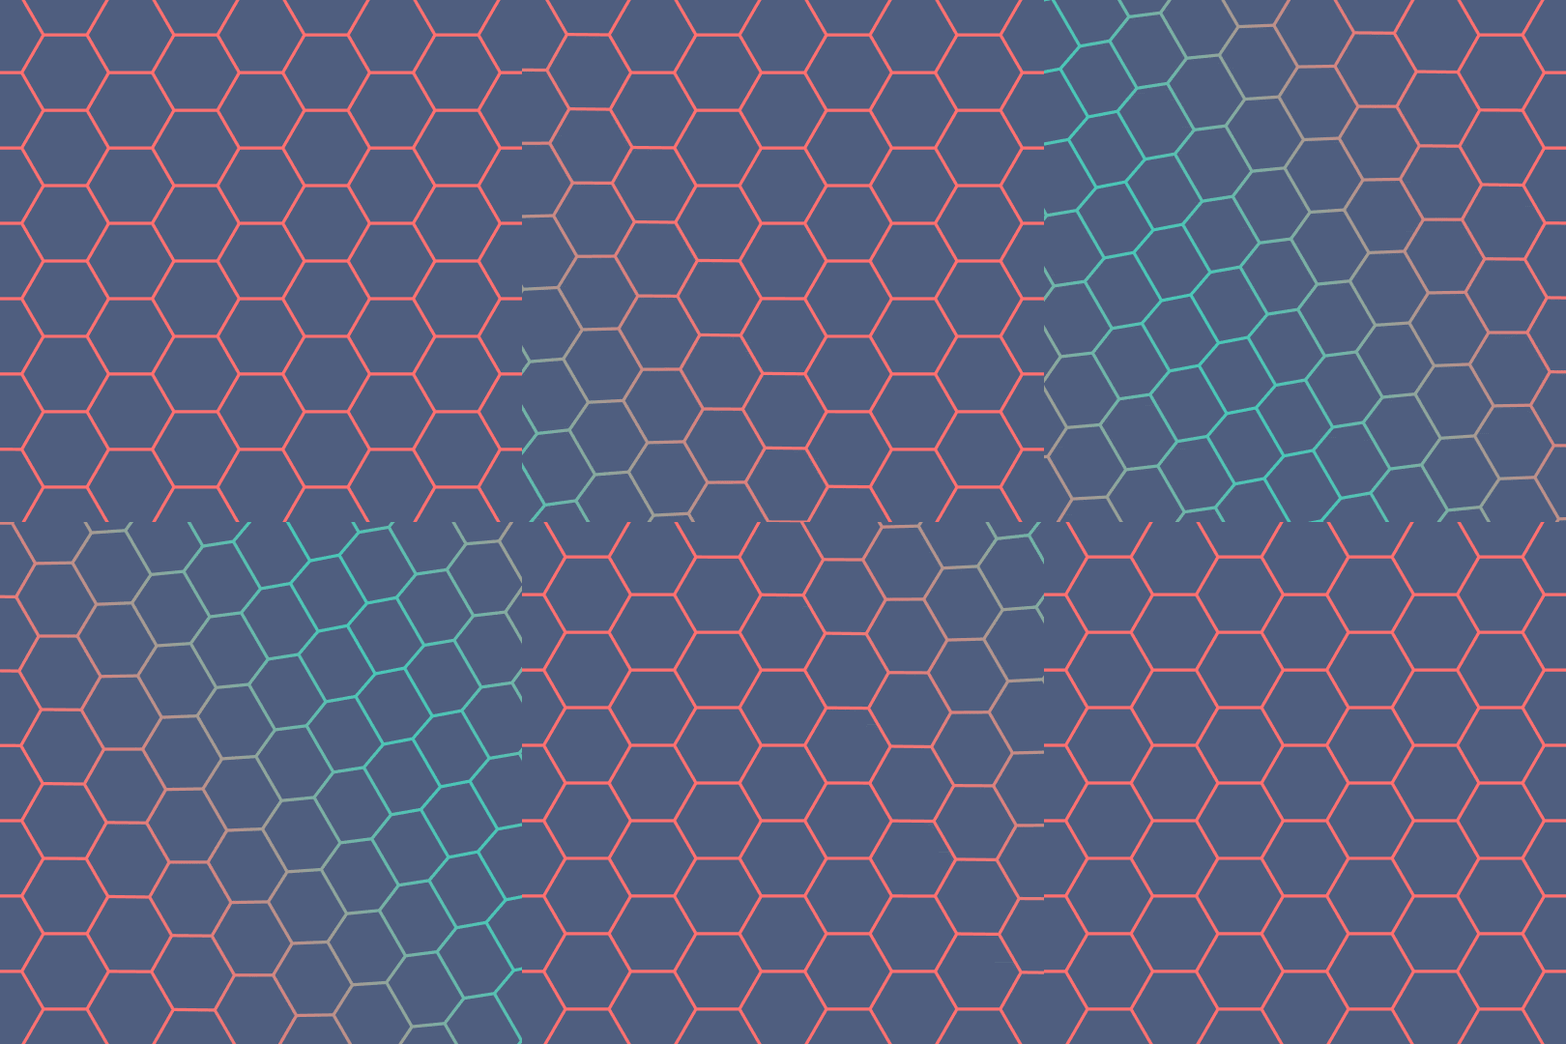
Compression
I started with the triangular grid I built for Release and applied VoronoiMesh to get a hexagonal lattice. Moving the points produces a nice animation, but unfortunately I couldn't figure out how to get variable colors on the edges of the mesh in a sensible way (I know I can color by index, but I couldn't get the numbering of the cells in the mesh to be consistent enough to be useful when I started moving things around).
Here's the code for the monochromatic VoronoiMesh version of this:
DynamicModule[{cols, dots},
 cols = {GrayLevel[.2], GrayLevel[.98]};
 Manipulate[
  dots = Flatten[
    Table[Haversine[
        Clip[t - ? (Sqrt[3]/2 y + 3/2 x + 4 +
              4 Sqrt[3])/(4 Sqrt[21]), {0, ?}]] 2 Sqrt[
        3] {Sin[?/3], Cos[?/3]} + {3 x/2,
       Sqrt[3] y + (1 - (-1)^x ) Sqrt[3]/4}, {x, -6, 5}, {y, -5, 5}],
    1];
  VoronoiMesh[dots, PlotRange -> 6, ImageSize -> 540,
    PlotTheme -> "Lines",
    MeshCellStyle -> {1 -> {Thickness[.004], cols[[1]]}, {2, All} ->
       cols[[-1]]}], {t, 0, 2 ?}]
 ]
(If you want to export the above to a GIF, it's a good idea to Rasterize the VoronoiMesh.)
Given my inability to get the colors I wanted, I ended up making a loose approximation to the Voronoi mesh by hand. It's definitely not exactly the same, but has some of the same basic characteristics. But it's certainly a dirty hack, and the code is correspondingly unpleasant:
DynamicModule[{cols, ?, points, b},
 cols = RGBColor /@ {"#FF7070", "#4AC6B7", "#4F5E7F"};
 ?[i_, j_, t_] := 4/5 (t - ? (i - j + 8)/20);
 b[i_, j_, t_] = Haversine[Clip[2 ?[i, j, t], {0, 2 ?}]];
 Manipulate[
  points = Table[
    {Blend[cols[[;; 2]], b[i, j, t]],
     Haversine[Clip[?[i, j, t], {0, ?}]] 2 Sqrt[
        3] {Cos[?/6],
        Sin[?/6]} + {(-1)^i/
          8 ((1 - b[i, j, t]/1.8) - (-1)^i * 5 + (-1)^i *6 i) +
        1, (-1)^i/8 Sqrt[
          3] (-(1 - b[i, j, t]/1.8) - (-1)^i*3 + (-1)^i * 2 i) -
        Sqrt[3] j}}, {j, -6, 5}, {i, -14, 10}];
  Graphics[{Thickness[.006], CapForm["Round"],
    Table[Line[points[[i, ;; , 2]],
      VertexColors -> points[[i, ;; , 1]]], {i, 1, Length[points]}],
    Table[Line[{points[[j, 2 i + 1, 2]], points[[j + 1, 2 i + 2, 2]]},
       VertexColors -> {points[[j, 2 i + 1, 1]],
        points[[j + 1, 2 i + 2, 1]]}], {j, 1, 11}, {i, 1,
      Length[points] - 1}]}, PlotRange -> 6, ImageSize -> 540,
   Background -> cols[[-1]]], {t, 0., 2 ?}]
 ]