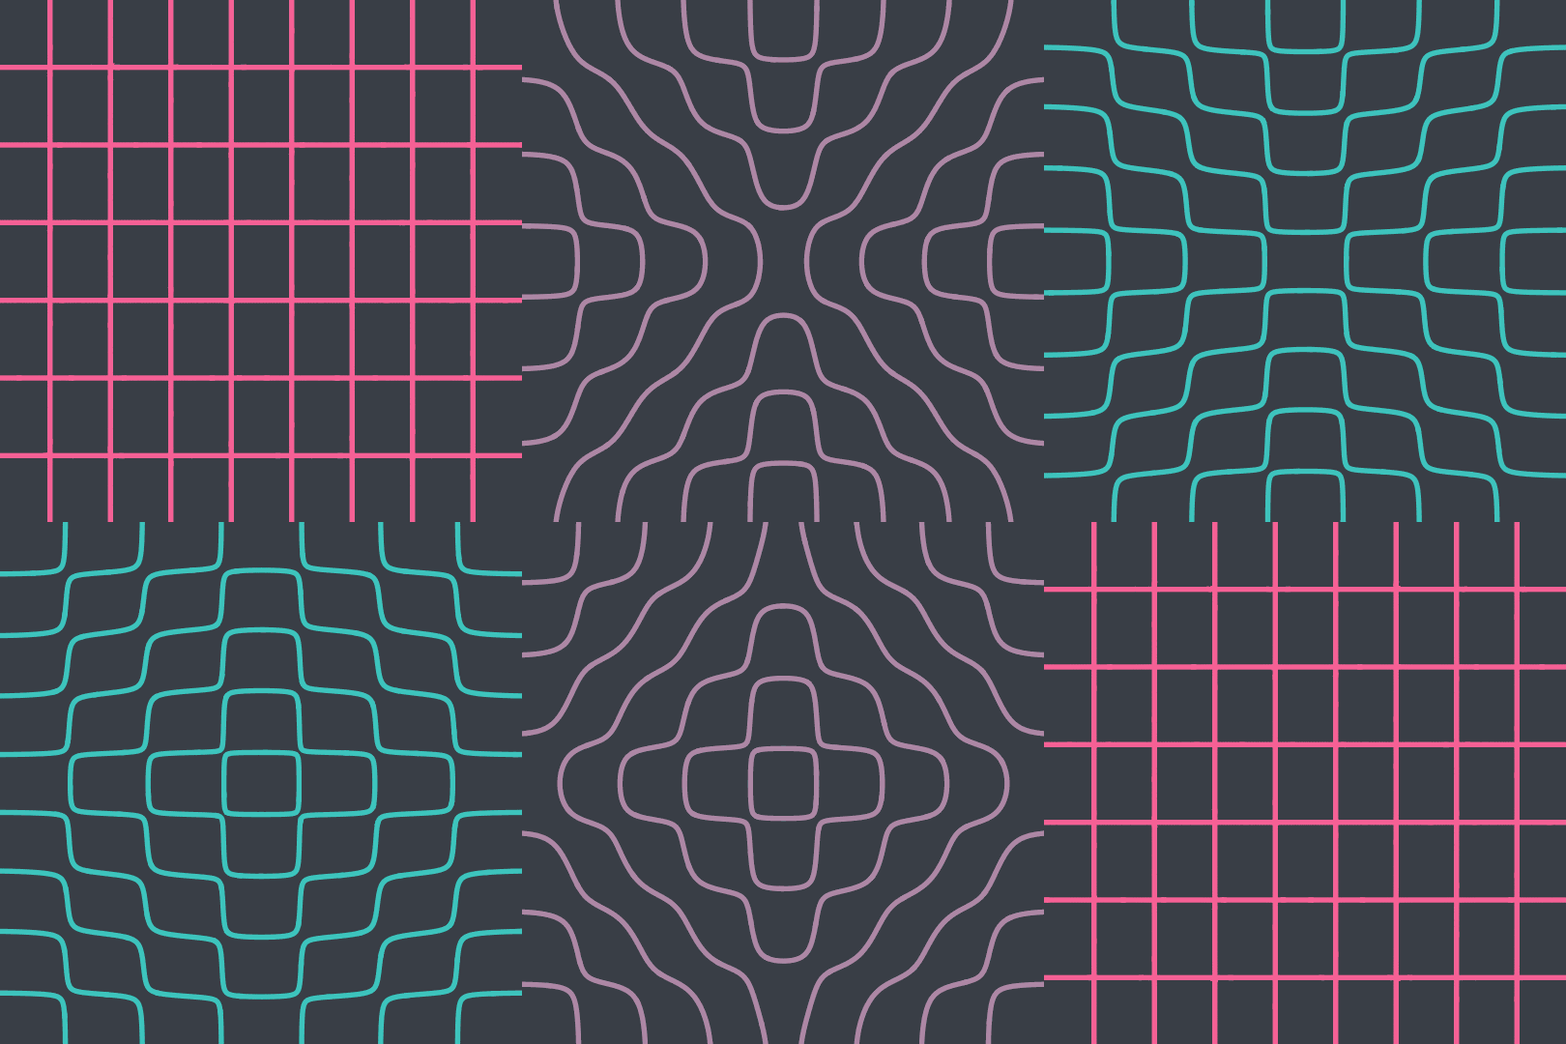
The Band Plays On
Following up on Drumbeat, which shows one of the vibration modes of a circular drum, here are the nodal lines of a family of vibration nodes of a square drum. Cribbing from the MathWorld article, the vertical displacement of the $(p,q)$ vibration mode of a $1 \times 1$ square drum is
$u_{pq}(x,y) = (A \cos \omega_{pq} t + B \sin \omega_{pq} t) \sin(p \pi x) \sin (q \pi y)$,
where $\omega_{pq} = \pi \sqrt{p^2 + q^2}$. This is easy enough to turn into a function:
?[p_, q_] := ? Sqrt[p^2 + q^2];
?[x_, y_, t_, p_, q_, A_, B_] := (A Cos[?[p, q] t] + B Sin[?[p, q] t]) Sin[p ? x] Sin[q ? y];
In fact, the same holds for arbitrary rectangles, so long as the product of sines becomes $\sin(p\pi x/L_x)\sin(p \pi y/L_y)$ where $L_x$ and $L_y$ are the lengths of the sides of the rectangle. The nice thing about squares is that you get an extra symmetry: the $(p,q)$ mode and the $(q,p)$ mode have the same frequency, so any linear combination will also form a standing wave.
In the animation, I'm taking the combination $u = u_{7,9} + c u_{9,7}$ and (by letting $c=\tan \theta$) varying $c$ from $-\infty$ to $\infty$. The curves in the animation are the so-called Chladni figures, or nodal lines of the vibration, meaning the solutions of $u=0$.
Anyway, here's the code:
With[{p = 7,
  q = 9,
  A = 1,
  B = 0,
  cols = RGBColor /@ {"#F66095", "#2BCDC1", "#393E46"}},
 Manipulate[
  ContourPlot[
   ?[x, y, 0., p, q, A, B] +
     Tan[(?/2 - .0001) (Haversine[Mod[2 ?, ?]] +
          Floor[2 ?/?] - 1)] ?[x, y, 0., q, p, A, B] == 0,
   {x, .01, .99}, {y, .01, .99},
   Axes -> False, Frame -> False,
   ContourStyle ->
    Directive[CapForm["Round"], Thickness[.01],
     Blend[cols[[;; -2]], Haversine[2 ?]]],
   PlotRangePadding -> -0.01, ImageSize -> 540,
   Background -> cols[[-1]]
   ], {?, 0., ?}]
 ]