First, I should point out that ContourLabels is not a valid option for ContourPlot3D (which is why it should appear red in the notebook).
We might, however, be able to use the information inside of the resulting Graphics3D to place labels.
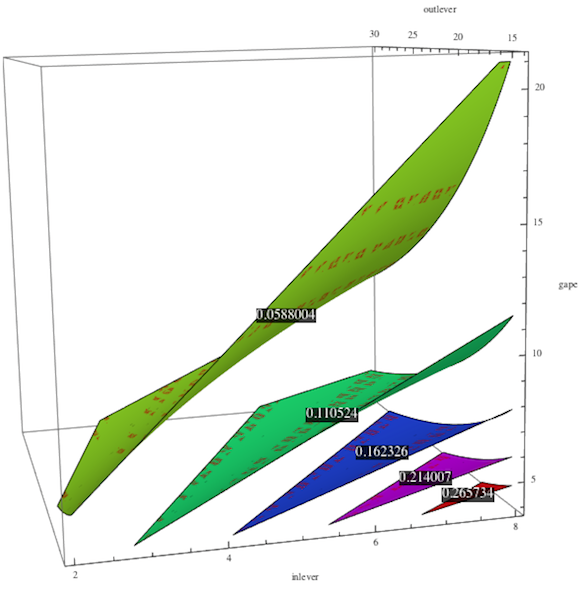
func[{x_, y_, z_}] := ((2/3)*50*(x/y))/(z*15)
cp3d = ContourPlot3D[
func[{x, y, z}], {x, 2, 8}, {y, 14, 30}, {z, 4, 21},
AxesLabel -> {inlever, outlever, gape}, Contours -> 5,
ColorFunction -> Hue, Mesh -> None];
If you exmaine the InputForm of the cp3d expression you will see a lot of information. In particular, we are interested in the GraphicsComplex and GraphicsGroup parts. The first part of the GraphicsComplex expression is a list of coordinates which in turn are used by the GraphicsGroups (which in turn contain Polygons).
coords = Cases[InputForm[cp3d], GraphicsComplex[__], \[Infinity]][[1,1]]
The vertices of the Polygons are given in terms of indices, where the index corresponds to the position in the coordinates list in GraphicsComples. For example, Polygon[{1,2,3,4}] will pull use the the first four coordinates, while Polygon[{10,20,30,40}] will use the 10th, 20th, 30th, and 40th coordinates.
Our goal is to use this information to find a coordinate which is near the middle of each contour. The easiest thing to try is to calculate the mean. For the labels themselves we need to pick out a point on the contour and feed that to func.
means = Table[
Mean[Part[coords,
Flatten[Cases[InputForm[cp3d], GraphicsGroup[__], \[Infinity]][[
k, 1, 1, 1]]]]], {k, 1, 5}];
vals = Map[func[Part[coords, #]] &,
Cases[InputForm[cp3d], GraphicsGroup[__], \[Infinity]][[All, 1, 1,
1, 1, 1]]];
With these mean values the next step is to create the labels with Text. Using MapThread makes it pretty easy to also pass both the mean coordinate and the value of contour.
labels = MapThread[
Graphics3D[
Text[Style[#1, 14, White], #2,
Background -> Opacity[0.75, Black]]] &, {vals, means}]
In this case, I tint the background a bit to make it easier to read. Now with the labels in place, the final step is to use Show:
Show[cp3d, labels]
This should hopefully provide you with a scaffolding to even build your own function to more automatically place labels.